Isolation and identification of adipose-derived mesenchymal stem cells
Adipose-derived mesenchymal stem cells (ADSCs) were extracted from transgenic rats that expressed green fluorescent protein (GFP). Adult female Wistar rats were euthanized with ketamine/xylazine overdose, and adipose tissue was collected from the inguinal region. The adipose tissues were washed thrice with phosphate buffered saline (PBS) to remove debris and red blood cells and cut into small pieces. The obtained tissue explants were cultured in DMEM/F-12 (Gibco™, USA) supplemented with 10% fetal bovine serum (FBS, Gibco™, USA) and 2% penicillin/streptomycin (Sigma, Germany) and incubated at 37 °C and 5% CO2 until the outgrowing cell confluence reached 80%. Flow cytometry was used to assess cell surface markers such as CD34, CD90, and CD105 to confirm the lineage of the extracted mesenchymal cells. The cells were used between passages 3–5, and 5 × 10⁵ cells were seeded within each conduit the day before implantation using collagen hydrogel as the conduit filling.
Silk fibroin solution preparation
SF solution was prepared based on the literature32. Small pieces of Bombyx mori silk cocoons (Iran silk research center, Gilan, Iran) were boiled in 0.02 M Na2CO3 (Merck, Germany) aqueous solution for 30 min. The resulting fibers were rinsed three times with deionized water to remove sericin protein. After drying overnight at room temperature, the SF fibers were dissolved in 9.3 M LiBr (Sigma-Aldrich, Germany) (1 g of dried fibers in 4 mL of LiBr solution) at 65 °C for 4 h, resulting in a viscous solution. The solution was then dialyzed in a cellulose tube (12400 Dalton, Sigma) against distilled water for 3 days at room temperature to remove residual salts. The SF solution was centrifuged twice at 11,000 RPM to remove insoluble particulates, resulting in a final concentration of 7–8% (w/v), which was used without dilution. The solution was stored at 4 °C and used within 2 weeks.
Synthesis of gold nanoparticles (AuNPs)
The synthesis of colloidal Au was carried out according to the literature33. Briefly, a solution of hydrogen tetrachloroaurate trihydrate (HAuCl4.3H2O, Merck, Germany) (1 mM) in a round bottom flask was boiled. Trisodium citrate solution (Na3C6H5O7, Merck, Germany) (38.8 mM) was added rapidly to the boiling solution under vigorous stirring. The solution was stirred continuously for about 5 min and underwent a series of color changes before turning red. The suspension was stored at 4 °C until needed. The maximum optical absorbance was found at λmax ≈ 520 nm.
Preparation of SF/AuNPs films
First, the pH of the gold suspension was adjusted to 7.5 using NaOH (Merck, Germany) solution. The suspension was then added to the SF solution with a volume ratio of 1:2 silk: AuNPs and stirred gently for 10 min to ensure a homogeneous solution. Next, poly (ethylene oxide) (PEO, MW = 900,000 g/mol, Sigma-Aldrich, Germany) (0.16 wt/vol. %) was added to the SF/AuNPs solution. The final solution was stirred gently at room temperature and cast onto a 6-well culture plate. 100 µm of solution was cast in each plate to obtain a 41.27 ± 4.15 µm film thickness. After the scaffold was air dried, β-sheet formation was induced by treating it with 90% aqueous methanol (Merck, Germany) solution for 30 min. In order to create non-conductive conduits, deionized water was replaced by AuNPs suspension. Finally, the PEO was removed from the prepared film by immersing it in a water bath at room temperature for 24 h. The films were sterilized using 70% EtOH for in vitro and in vivo assessments.
Preparation of collagen hydrogel and decellularized rat sciatic tissue as conduit filler
Type I collagen was extracted from the rat tail tendon, as previously approved34. Briefly, the collected collagen fibers were placed in acetone (C3H6O, Merck, Germany) for 5 min and then transferred to isopropanol 70% (C3H8O, Merck, Germany) for 5 min. Eventually, after the fibers were dissolved in acetic acid for 48 h, a viscous solution was obtained. Finally, the solution was frozen at -20 °C and freeze-dried to get collagen sponges. The prepared collagen sponges were dissolved in 0.1 M acetic acid at a final 6.25 mg/ml concentration. The resulting solution was combined with a double buffer system (1.3M NaCl and 0.2M Na2HPO4.12H2O), 0.3M NaOH solution, and 10 × DMEM-F12 on ice to keep the temperature at 4 °C. In one experiment, 1 ml of collagen solution was mixed with 100 µl buffer, 300 µl NaOH, and 100 µl 10 × DMEM-F12. If seeding cells within the collagen hydrogel, the 10 × DMEM-F12 was replaced with cell suspension. Finally, the solution was incubated at 37 °C for 40 min to form the collagen hydrogel.
Decellularization of sciatic tissue was conducted in a modified protocol35. Briefly, an adult Wistar rat was euthanized using a ketamine/xylazine overdose, and the sciatic nerve tissues were harvested under aseptic conditions and pooled in sterilized PBS. The harvested tissues underwent three washes with PBS. The tissues were stirred in 1% sodium dodecyl sulfate (SDS) solution in deionized water at 25 °C for 24 h to facilitate decellularization. After SDS treatment, the tissue was washed in deionized water three times, each for 30 min. In the next step, tissues were stirred in 1% Triton X-100 (Merck, Germany) aqueous solution for one hour, followed by several washes over 72 h. Finally, the decellularized tissue was incubated in 70% ethanol for 5 min, treated with a cocktail of antibiotics containing penicillin, cefazolin, and amphotericin for 20 min, and washed several times with sterilized PBS36. The efficacy of the collagen hydrogel and decellularized sciatic nerve on enhancement of ADSCs proliferation was assessed using MTT assay.
Fabrication of nerve conduit filled by collagen hydrogel
The SF/AuNPs films were shaped as conduits to support topography and promote the growth of peripheral nerves. First, the films were wrapped around a glass rod with an outer diameter of 1.8 mm. A 4% SF solution was used to stabilize the conduit. Finally, the prepared conduits were filled with collagen hydrogel containing ADSCs and incubated at 37 °C and 5% CO2.
Physicochemical characterization of SF/AuNPs films
X-ray diffraction analysis
The XRD scans of the samples were recorded using the X-ray diffractometer (Inel EQUINOX3000, France) operating at 40 kV and 30 mA. The samples were scanned in the 2θ range of 5°–80° with a scanning speed of 10°/min.
Electrical conductivity
The electrical resistances of SF/AuNPs and SF films were measured repeatedly using a multi-meter by the four-probe method under ambient conditions. After three measurements, conductivity was calculated using the following formula:
$${text{R}} = uprho {text{L}}/{text{Wt}}$$
(1)
$$upsigma = {1}/uprho$$
(2)
where R, ρ, L, W, and t are the slope of the current flow-voltage curve, resistivity, length, width, and thickness of the scaffold, respectively, and σ is the electrical conductivity of the scaffolds.
Mechanical properties of SF/AuNPs films
The scaffold’s tensile properties were assessed using a uniaxial testing instrument (Instron 5566, USA). Samples were cut to 15 mm × 5 mm × 0.03 mm (height × width × thickness), and loaded into tension clamps with an initial gauge length of 10 mm. Prior to testing, all samples were stored in a PBS bath at room temperature. The samples were then elongated at a 3 mm/min rate until failure. Stress/strain plots were used to calculate the initial elastic modulus (EM), ultimate tensile strength (UTS), burst strength, and % elongation to failure (ETF). The EM was estimated through a least-squares (LS) fit within the linear elastic region, while the UTS was determined as the highest stress value achieved during the test. The ETF was the last data point before rupture. At least three samples were used to calculate the average modulus with standard deviation.
Field emission scanning electron microscopy (FE-SEM)/energy dispersive X-ray analysis (EDXS)
Imaging was conducted with FE-SEM ZEISS (Sigma 300, Germany) to investigate the scaffold morphology. A 40 nm coating of gold was sputter-coated onto the sample. ImageJ software was used to analyze the acquired images. The elemental content identification and quantification were assessed using the energy-dispersive X-ray spectrometer (EDS, TESCAN MIRA3). Integrated mapping software was then used to examine the distribution of the elements.
MTT assay
The effect of AuNPs, decellularized sciatic tissue, collagen hydrogel, SF, and SF/AuNPs films on cellular metabolism was evaluated through MTT assay using rat ADSCs. The cells in plates without scaffolds were used as controls. Each scaffold was placed in a well of a 96-well tissue-culture plate. A total of 1 × 10⁴ cells were seeded onto the scaffolds in each well and incubated at 37 °C, 5% CO2 for 48 h. After that, 10 μL of MTT solution with a concentration of 5 mg/ml was added to each well. After 4 h of incubation at 37 °C, the medium was replaced with 100 µl DMSO, and absorbance was measured at 540 nm using a microplate reader (Elx800, BioTek, USA). All MTT results are obtained from two different experiments with 7 replications for each sample.
Analyzing the distribution of ADSCs within collagen hydrogel and on SF/AuNPs films
The ADSCs were obtained from GFP transgenic rats. Forty-eight hours after cell seeding, the scaffolds were fixed in 4% PFA and washed in phosphate-buffered saline (PBS). We then captured digital images of the scaffolds using a fluorescence microscope. To ensure that the cells visible in the images were within the collagen hydrogel, we transferred the hydrogel-containing cells to a new cell culture plate before imaging.
Experimental design
Adult female Wistar rats (200–250 g, 12 weeks old) were housed under controlled temperature and humidity with a 12:12 light: dark cycle and fed standard chow and water ad libitum. 25 rats were randomly divided into five groups: (1) gold standard control (n = 5), (2) non-conductive conduit without ES (n = 5), (3) conductive conduit without ES (n = 5), (4) non-conductive conduit with ES (n = 5), and (5) conductive conduit with ES (n = 5) (Table 1).
Animal surgery and electrical stimulation application
The surgical procedures were conducted using an operating microscope and an aseptic approach in the animal facility room. Rats were anesthetized with an intraperitoneal injection of a mixture of Ketamine (90 mg/kg) and Xylazine (10 mg/kg). The animals’ body temperature was closely monitored and placed on an electric heating pad during surgery. A 2 cm incision was made parallel and just below the right femur bone of the rats. The septum separating the vastus lateralis and biceps femoris muscles was bluntly dissected to reveal the sciatic nerve. The sciatic nerve was delicately extracted from the adjacent tissues. A 10 mm segment of the right sciatic nerve was transected in all animals 5 mm proximal to its bifurcation. In control group, the dissected segment of the sciatic nerve was reversed in polarity and microsurgically coapted distally and proximally to proximal and distal stumps, respectively, using two epineurial 10–0 nylon monofilament sutures (Ethicon Inc., Somerville, NJ). In other groups, a 12 mm conduit was placed deep in the gap, and one mm of each stump was inserted into the conduit to prevent the staggering of the nerve; the conduit was secured to both sides using two epineurial 10–0 nylon sutures (Fig. 1). After securing the conduit for groups 4 and 5 to deliver ES, the cathode (+) electrode was 5 mm proximal to proximal coaptation, and the anode (−) electrode was placed to the approximate biceps muscle. Thereafter, ES was delivered with 20 Hz frequency, 0.1 ms duration of the pulse, and 1.2 V (the maximum voltage tolerated by the animal) for 30 min. After ES delivery, electrodes were removed, and muscle approximation and skin closure were done via 5–0 Vicryl® suture (Ethicon Inc., Somerville, NJ). To prevent autotomy, saturated picric acid was topically applied to the hindlimb37.
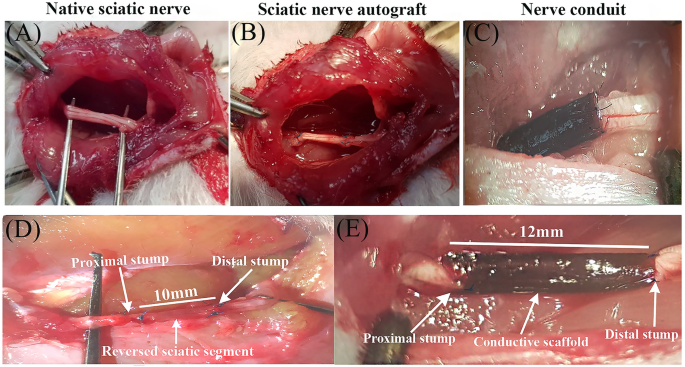
Placement and securing the autograft and nerve conduits following sciatic nerve transection. (A) Native sciatic nerve before transection, (B and D) Sciatic nerve autograft, in this group the dissected segment of the sciatic nerve was reversed in polarity and microsurgically coapted distally and proximally to the proximal and distal stumps, respectively. (C and E) In the conduit groups, a 12 mm conduit was placed deep in the gap, and one mm of each stump was inserted into the conduit to prevent the staggering of the nerve.
Walking track analysis
SFI was the most frequent index in evaluating hindlimb motor function following sciatic nerve transection38,39,40. In addition, static sciatic index (SSI), peroneal functional index (PFI), and tibial functional index (TFI) were calculated and reported40,41,42.
Sciatic functional index (SFI)
The rats were placed in a corridor with a length of 1.5 m and a width of 20 cm with a height of 40 cm covered thoroughly with see-through glass. The background of the corridor was covered with black paper to increase the contrast, remove excessive lights, and prevent reflexes. A mirror with a slope of 45˚ was placed below the gallery to see the reflection of the paw trace of the rats. Rats were trained to walk through the corridor one week before surgery. Each rat walked through the corridor thrice and was filmed during the whole process. Recorded videos were analyzed, and 5 captures were used to calculate SFI for each rat. SFI compares geometric measures of the injured paw with the normal paw. SFI could be calculated through the following formula38,39,40:
$$SFI = – 38.3 times left( {frac{EPL – NPL}{{NPL}}} right) + 109.5 times left( {frac{ETS – NTS}{{NTS}}} right) + 13.3 times left( {frac{EIT – NIT}{{NIT}}} right) – 8.8$$
where EPL, ETS, and EIT are experimental print length, experimental toe spread, and experimental intermediary toe spread, respectively, and NPL, NTS, and NIT are the same indices for the normal paw.
Static sciatic index (SSI)
SSI is a time-saving method for the evaluation of peripheral nerve regeneration in rats. It only considers static factors and ignores print length. It is calculated according to the following equation42:
$$SSI = 108.44 times left( {frac{ETS – NTS}{{NTS}}} right) + 31.85 times left( {frac{EIT – NIT}{{NIT}}} right) – 5.49$$
ETS, NTS, EIT, and NIT are explained in the SFI section.
Histological evaluations
Sciatic nerve tissues were harvested, fixed in 10% neutral-buffered formalin, and processed for paraffin embedding. Sections of 5 µm were stained with Hematoxylin and Eosin (H&E) for general tissue morphology, where hematoxylin imparted a blue hue to the nuclei while eosin stained the cytoplasm pink. For myelin detection, sections underwent Luxol Fast Blue (LFB) staining overnight. Subsequently, immunohistochemistry was performed on deparaffinized sections, involving heat-induced antigen retrieval, blocking steps, and overnight incubation with primary antibodies specific to neurofilament (NF200, ab7255) and S100 (ab34686) proteins. Detection involved biotinylated secondary antibodies, streptavidin-peroxidase complex, and chromogen development with 3,3′-diaminobenzidine (DAB, Abcam), followed by hematoxylin counterstaining. The stained sections, indicative of various cellular and tissue elements, were systematically analyzed under a bright-field microscope, with images captured for detailed qualitative and quantitative assessment of histological characteristics and specific protein expression patterns43. The samples from all groups at 6 weeks were stained with 4,6-diamidino-2-phenylindole (DAPI) to mark the nucleus of all cells. Moreover, the ADSCs seeded on the scaffold were GFP positive, and immunofluorescent microscopy was used to capture the survival, migration, and distribution of GFP positive ADSCs and rat cells.
Transmission electron microscopy (TEM) of tissues
Sciatic nerves were surgically extracted from adult rats and were immediately fixed in 2.5% glutaraldehyde with 0.1M cacodylate buffer, followed by post-fixation in 1% osmium tetroxide, ensuring the preservation of cellular ultrastructure. The samples underwent a graded dehydration process in an ethanol series before embedding in epoxy resin. After polymerization, ultrathin sections (60 nm) were sliced using an ultramicrotome and collected on copper grids for imaging. These procedures aimed to maintain the intricate details of the sciatic nerve, including Büngner bands, Schwann cells, axons, and histiocytes, for high-resolution visualization under the TEM.
The TEM analysis was conducted using a Philips CM200 Transmission Electron Microscope featuring a field emission gun and a 0.24 nm resolution. It includes a Gatan Orius SC1000 CCD camera for improved image capture and operates at 80–200 kV accelerating voltages. Initial low-magnification examination identified regions of interest, which were subsequently imaged at higher resolution. The resulting greyscale micrographs were digitally enhanced for clarity and contrast before undergoing a pseudo-coloring process. This coloring was not indicative of inherent staining properties. Still, it was applied manually to distinguish various structural aspects: Büngner bands (red), Schwann cell nuclei (blue), Schwann cell cytoplasm (yellow), axons (purple), and histiocytes (green). This meticulous process with expert verification allowed for a more intuitive visual interpretation of the complex cellular interactions within the sciatic nerve tissue. However, it did not provide molecular-level specificity44.
Image analysis
Image analysis was done using NIH-ImageJ version 1.53 k (https://imagej.net/ij/download.html). The evaluations encompassed counting myelinated axons in the nerve sections, gauging the myelin sheath thickness from TEM images, and quantifying the IHC results based on the percentage of positively stained areas. For a thorough assessment, three random fields of 80 mm × 60 mm each from every nerve specimen were inspected at 400× magnification45.
Statistical analyses
All quantitative data are expressed as mean ± standard deviation (SD). Statistical comparisons for histopathological findings were performed by one-way analysis of variance (ANOVA) using GraphPad Prism version 8.0.2. Moreover, one-way ANOVA was used to compare the SFI scores between groups, and a linear mixed model with Tukey posthoc test was used to compare the SFI scores between rats through time points using R programming language version 4.2.1. P values of less than 0.05 were considered statistically significant.
Ethical approval
All animal experiments were performed in accordance with Tehran University of Medical Sciences (TUMS) guidelines, and animal care protocols were approved by the Ethical Committee of the TUMS (IR.TUMS.CHMC.REC.1398.120). Additionally, reporting of use of experimental animals in this study adhered to the recommendations outlined in the ARRIVE guidelines.
- SEO Powered Content & PR Distribution. Get Amplified Today.
- PlatoData.Network Vertical Generative Ai. Empower Yourself. Access Here.
- PlatoAiStream. Web3 Intelligence. Knowledge Amplified. Access Here.
- PlatoESG. Carbon, CleanTech, Energy, Environment, Solar, Waste Management. Access Here.
- PlatoHealth. Biotech and Clinical Trials Intelligence. Access Here.
- Source: https://www.nature.com/articles/s41598-024-65286-9