Delayed dual SMAD inhibition is necessary for the concurrent development of neural and mesodermal lineages from NMPs
We used five different hPSC lines (see methods section) to explore their potential to generate a self-organizing NMJ (soNMJ) model through an NMP state. We have previously used hPSC-derived NMP cells to generate NMOs in 3D under minimal culture media. However, the direct transfer of the protocol from 3D to 2D was insufficient to generate a functional NMJ model in adherent culture conditions. Analysis of the adherent cultures after applying the NMO conditions at days 20 and 50 revealed the presence of neurons expressing TUBB3 and a few muscle progenitors expressing DESMIN at day 20, which gave rise to only a few differentiated skeletal myofibers at day 50 (Supplementary Fig. 1).
We reasoned that transposition of the 3D early NMO culture conditions in 2D may change the autocrine signal signature. BMP inhibition promotes the specification into paraxial mesoderm and skeletal muscles2,18 whereas TGFβ inhibition further enhances the efficiency of hPSCs differentiation into somites19. Thus, we employed both BMP and TGFβ inhibition using the dual SMAD inhibitor cocktail (2SMADi)19,20. We first assessed the effect of 2SMADi at the NMP induction stage (day 0 – day 3) (Supplementary Fig. 2a). We instructed the generation of NMPs using our previously established protocol21,22. Initial exposure of hPSCs to WNT agonist (CHIR) and basic FGF (bFGF) signals for three days resulted in the efficient generation of NMP cells that co-expressed the nascent mesodermal marker BRACHYURY (TBXT) and the neural progenitor marker SOX2. Paraxial mesoderm TBX6+ cells were also evident mainly in the periphery of the NMP colonies (Supplementary Fig. 2b, c). We observed that simultaneous, early treatment of hPSCs with CHIR/bFGF and 2SMADi resulted in the generation of cells that expressed high levels of SOX2 and low levels of TBXT in the absence of TBX6 (Supplementary Fig. 2b, c, d). The low levels of TBXT agreed with the known role of SB431542 to mediate TBXT suppression23. Thus, the addition of 2SMADi changed the balance of TBXT and SOX2 towards a more SOX2-high fate (Supplementary Fig. 2e).
To determine the effect of 2SMADi in rostro-caudal identity, we analyzed the expression of the posterior markers CDX2, NKX1.2, and HOXB1 and the anterior marker OTX2 in hPSCs treated during day 0 – day 3 with (i) 2SMADi, (ii) WNT/bFGF/2SMADi and (iii) WNT/bFGF (Supplementary Fig. 2a). Cells treated with 2SMADi alone acquired an anterior neural identity expressing the neural progenitor markers SOX2, SOX1 and OTX2, indicative of an anterior neural identity and in agreement with previously published studies20 (Supplementary Fig. 2d). The WNT/bFGF condition alone resulted in the generation of NMPs that express the posterior markers CDX2 and NKX1.2 as previously described21,22,24. The simultaneous addition of 2SMADi and WNT/bFGF resulted in the generation of posterior cells expressing CDX2 and HOXB1. A striking difference between the WNT/bFGF/2SMADi and WNT/bFGF treatments was the upregulation of NKX1.2 and SOX2 in the former (Supplementary Fig. 2d); this upregulation was associated with a pre-neural tube identity25. We next examined the potential of the WNT/bFGF/2SMADi treated cells to differentiate into neural and mesodermal progenitors. To enhance the generation of both cell types, we continued the treatment from day 3 to day 6 with WNT/bFGF/2SMADi in the presence of retinoic acid (RA) and the SHH smoothened agonist (SAG) to induce a ventral identity (Fig. 1a). Analysis of cells on day 6 revealed the exclusive differentiation into neural progenitor cells expressing SOX2, SOX1, PAX6, and NKX1.2 (Fig. 1b, c). Genes associated with a presomitic (PSM) identity, such as MEOX1, FOXC1, FOXC2, and MYF5 were not expressed (Fig. 1b). Thus, exposure of cells to the 2SMADi during the NMP induction stage precludes mesoderm formation. This was in agreement with the finding that 2SMADi promotes the preferential differentiation of hPSCs towards the neuroectodermal lineage20,26.
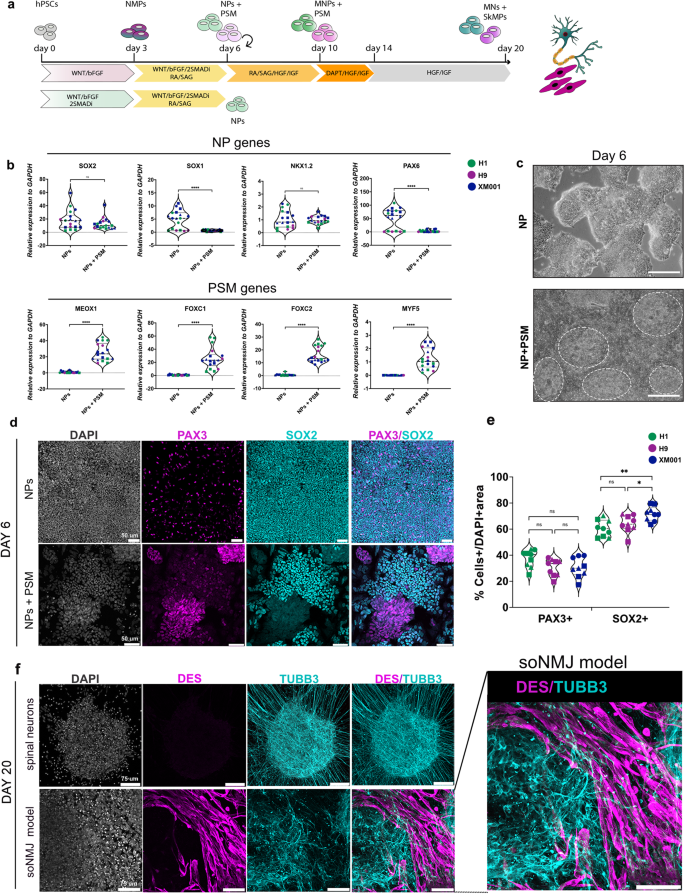
a Schematic representation illustrating the strategy employed to generate the soNMJ model and NPs from hPSCs. b qPCR analysis on day 6 demonstrated that administration of dual SMADi (2SMADi) from day 0 – day 6 resulted in the differentiation of hPSCs to NPs expressing high levels of SOX2, SOX1, NKX1.2 and PAX6. Administration of 2SMADi from day 3 − day 6 was sufficient to generate both NP cells and PSM cells expressing MEOX1, FOXC1, FOXC2 and MYF5. The statistical tests employed included an unpaired t-test with Welch’s correction. *P ≤ 0.05; **P ≤ 0.01; ***P ≤ 0.001; ****P ≤ 0.0001. Each dot with the same colour/shape represents different wells from a single differentiation experiment of a specific cell line. The dashed line is the median value. XM001: N = 3, n = 9; H1: N = 2, n = 6; H9: N = 1, n = 3. Source data are provided as a Source Data file. c Representative brightfield images of NP and NP + PSM cultures at day 6. Circles mark PSM colonies. Scale bars: 100 µm. d Immunofluorescence analysis at day 6 of differentiation showed that exposure to 2SMADi since day 0 resulted in the generation of SOX2+ NPs in the absence of mesodermal cells. Co-expression of PAX3 and SOX2 corresponded to dorsal NPs. Conversely, exposure to 2SMADi after day 3 resulted in the segregation of NMP cells to SOX2+ NPs and PAX3+ PSM cells. e We quantified the number of PAX3+ cells in H1 (37.5% ± 6.6%), H9 (30.6% ± 6.5%) and XM001 (30.6% ± 7.6) lines, and the number of SOX2+ cells in H1 (60.4% ±6.4%), H9 (64% ± 6.7%) and XM001 (71.8% ± 5.6%). The statistical tests employed included one-way ANOVA with Bonferroni’s multiple comparison test. *P ≤ 0.05; **P ≤ 0.01; ***P ≤ 0.001; ****P ≤ 0.0001. Each dot with the same colour/shape represents a sample from a single differentiation experiment of a specific cell line. The dashed line is the median value. XM001: N = 3, n = 9; H1: N = 3, n = 9; H9: N = 3, n = 9. Scale bars: 50 µm. Source data are provided as a Source Data file. f Immunofluorescence analysis at day 20 of differentiation showed that early exposure to 2SMADi from day 0 – day 6 resulted in the generation of TUBB3+ neurons. Exposure to 2SMADi after day 3 resulted in the segregation of NMPs into DESMIN+ myoblast cells and TUBB3+ neurons. The immunofluorescence analysis was performed in the H1, H9 and XM001 cell lines (also see Table S1). Scale bars 75 µm. NPs Neural progenitors, PSM Pre-somitic mesoderm, 2SMADi dual-SMAD-inhibition, soNMJ model: self-organizing neuromuscular junction model.
We then explored whether applying 2SMADi after NMP induction could potentiate the simultaneous development and differentiation of neural and mesodermal progenitors (Fig. 1a). Indeed, exposure of NMP cells to WNT/bFGF/2SMADi in the presence of RA and SHH for three days (day 3 – day 6) resulted in the generation of clearly segregated neural and mesodermal progenitor clusters that self-organized in the dish (Fig. 1c). The neural progenitor clusters expressed SOX2, whereas the mesodermal clusters expressed PAX3 in the absence of SOX2 (Fig. 1d). We quantified the number of PAX3+ and SOX2+ cells in the H1, H9 and XM001 cell lines. All hPSC lines were able to generate the NP (SOX2+) and PSM (PAX3+) populations, confirming the reproducibility of the protocol (Fig. 1e). However, in agreement with our previous findings, we observed that the XM001 and H9 lines were more primed to differentiate towards the neural lineage27. Some PAX3+ cells were also evident in the neural SOX2+ clusters corresponding to dorsal neural progenitor identity. PSM-specific genes were also upregulated (Fig. 1b). Thus, we concluded that early treatment of hPSCs with 2SMADi, even in the presence of WNT/bFGF primes NMPs towards an exclusive neural identity, whereas treatment after the establishment of the NMP state, allows the simultaneous differentiation to both neural and PSM lineages at day 6.
We next sought to analyze the potential of these cultures to differentiate into spinal cord neurons and skeletal muscle cells. Thus, we passaged the cells at day 6 and plated them in an optimized neurobasal (NB) medium containing 500 nM RA, 500 nM SAG, 2 ng/ml HGF and 2 ng/ml IGF, which could support both the specification of neural progenitor cells towards a ventral MN identity and the proliferation of mesodermal progenitors. RA and SAG were used to pattern the neuroectoderm towards a ventral MN identity at concentrations previously described by Maury et al.22,25. The inclusion of HGF and IGF ensured the survival and proliferation of mesodermal progenitors18. At day 10, most neural cells expressed the MN progenitor marker OLIG2, at which timepoint progenitors were treated with the γ-secretase inhibitor DAPT to accelerate the generation of MNs4. Analysis on day 14 revealed the presence of both OLIG2+ cells and HB9+ differentiated MNs (Supplementary Fig. 3a). After day 14, cells were maintained in the presence of only HGF and IGF which were essential for the proliferation and survival of the muscle progenitor cells in the soNMJ model.
Comparison of the expression profile of genes associated with neural and mesodermal differentiation between day 3, day 6, and day 20 confirmed the differentiation of NMP cells to neural progenitors that expressed SOX2, SOX1, OLIG2, and more differentiated MNs that expressed ISL1, FOXP1, and CHAT (Supplementary Fig. 3b). As expected, on day 20, the expression of the muscle-specific progenitor markers MYF5 and MYOD was upregulated. In contrast, the expression of the early mesodermal marker MSGN1 was completely downregulated (Supplementary Fig. 3b). The early segregation of NP and PSM clusters, observed at day 6, was maintained and developed into clusters of differentiated neural TUBB3+ cells and muscle DESMIN+ progenitors at day 20 (Fig. 1f). Quantitative analysis of the neural and muscle-specific cell types revealed the presence of 18.9% ± 10.1% ISL1+ cells, 20.9% ± 7.6 % SOX1+ and 58.4% ± 10.7% MYF5+ cells (Fig. 2a, b).
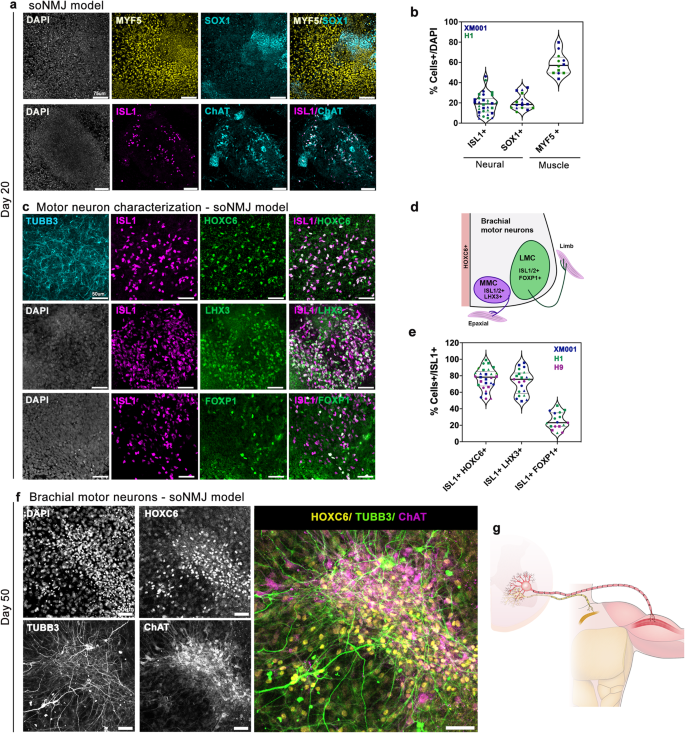
a Immunofluorescence analysis at day 20 in the soNMJ model revealed the presence of MYF5+ skeletal muscle progenitors and SOX1+ NPs. The presence of MNs was shown by the expression of ISL1 and ChAT. Scale bars: 75 µm. b Quantification of SOX1+ NPs (20.9% ± 7.6%), MNs expressing ISL1 (18.9% ± 10.1%), and skeletal muscle progenitors expressing MYF5 (58.4% ± 10.7%). ISL1 (H1: N = 3, n = 16; XM001: N = 3; n = 13); SOX1 (H1: N = 2, n = 6; XM001 N = 3; n = 9); MYF5 (H1: N = 2, n = 6; XM001: N = 2; n = 6) Source data are provided as a Source Data file. c Analysis of the MN population at day 20 revealed the presence of brachial MNs co-expressing HOXC6 and ISL1. Both LMC MNs expressing ISL1/FOXP1 and MMC MNs expressing ISL1/LHX3 were present in the soNMJ model. Scale bars: 50 µm. d Schematic illustration of MN columnar organization at the brachial spinal cord. e Quantification of HOXC6+/ISL1+ cells showing a prevalence of brachial MNs in the soNMJ model (80.2% ± 11.9%). Both MMC MNs (72.4% ± 14.4%), characterized by ISL1/LHX3 co-expression, and LMC MNs (25.3% ± 10%), characterized by ISL1/FOXP1 co-expression were present. ISL1 + HOXC6+ (H1: N = 3, n = 11; XM001: N = 3; n = 9; H9: N = 3, n = 9); ISL1 + LHX3+ (H1: N = 3, n = 9; XM001 N = 3; n = 9; H9: N = 1, n = 3); ISL1 + FOXP1+ (H1: N = 3, n = 9; XM001: N = 1; n = 3; H9: N = 2, n = 4). Source data are provided as a Source Data file. f Immunofluorescence analysis of brachial MNs expressing TUBB3, HOXC6, and ChAT at day 50. Scale bars: 50 µm. H1: N = 3, n = 9; XM001: N = 3, n = 9. g Schematic illustration of the neuromuscular connectivity in the human body at the forelimb level. soNMJ model: self-organizing neuromuscular junction model; NPs: neural progenitors; MNs: motor neurons; MMC: median motor column; LMC: lateral motor column.
Collectively, the data showed that 2SMADi during the NMP induction stage effectively eliminates the mesodermal lineage giving rise to posterior neurons. In contrast, delayed 2SMADi exposure, after the induction of NMP state, promotes the simultaneous development and differentiation of both neural and mesodermal lineages. Then, cells self-organize into distinct clusters of differentiated neurons and muscle progenitors. Thus, fine-tuning the timing of 2SMADi exposure allows the selective differentiation to either exclusively posterior neurons or neuromuscular cells.
Efficient generation of a position-specific soNMJ model that includes supporting glial cells
Generating position-specific spinal cord neurons is necessary for proper disease modeling and transplantation studies. Thus, we next sought to characterize the rostocaudal and columnar identity of the spinal cord neurons in this neuromuscular model. It is well established that the identity of spinal cord neurons is instructed by the differential expression of HOX genes28. To define the rostrocaudal identity, we examined the expression of HOX proteins at day 20. Most MNs co-expressed HOXC6/ISL1 (80.2% ± 11.9%), confirming their predominant brachial spinal cord identity (Fig. 2c, e). We then assessed the acquisition of a defined columnar subtype identity. At the brachial spinal cord level, MNs are organized into two columnar identities corresponding to the lateral motor column (LMC) and median motor column (MMC) (Fig. 2d)28. Analysis with specific columnar identity markers revealed that within the MN population, approximately 80% of the MNs co-expressed ISL1/LHX3 (72.4% ± 14.4%), associated with MMC identity while 20% co-expressed ISL1/2 /FOXP1 (25.3% ± 10%) associated with LMC identity (Fig. 2c, e).
Consistent with continuing maturation, at day 50, brachial spinal cord MNs were expressing the acetylcholine-synthesizing enzyme choline acetyltransferase (ChAT) and HOXC6 (Fig. 2f)29. It is worth noting that the MNs survived and matured in the neuromuscular model without external supplementation of neurotrophic factors (Supplementary Fig. 4a, b). Maturation of MNs in reductionist models depends on the addition of a medium enriched for glial-derived neurotrophic factor (GDNF), brain-derived neurotrophic factor (BDNF) as well as ciliary neurotrophic factor (CNTF)4,29. However, this is not required in this neuromuscular model, probably due to the presence of muscle and glial cells that support the MNs.
GFAP+ glia cells were first detected on day 50 without adding factors that support gliogenesis or serum30. This suggested that in the neuromuscular model neural progenitor cells can be maintained long enough to make the gliogenic switch. Indeed, the number of glial cells significantly increased from day 50 to day 100, recapitulating the later developmental timing of glial cells in vivo (Supplementary Fig. 4c, d). Additionally, day 50 immunostainings revealed the presence of V2a excitatory pre-motor interneurons, marked by expression of CHX1031 and V1, V0, and dI6 interneurons marked by PAX2/LHX1 expression32 (Supplementary Fig. 4e, f).
Therefore, timely application of the appropriate instructive and mitogenic signals until day 25 generates a neuromuscular model of defined rostrocaudal and columnar identity (Fig. 3a). Then, the co-developing cell types provide the necessary autocrine and paracrine signals giving rise to a dynamic, self-instructing model system that develops and matures with minimal requirements for exogenously added differentiation and maturation factors.
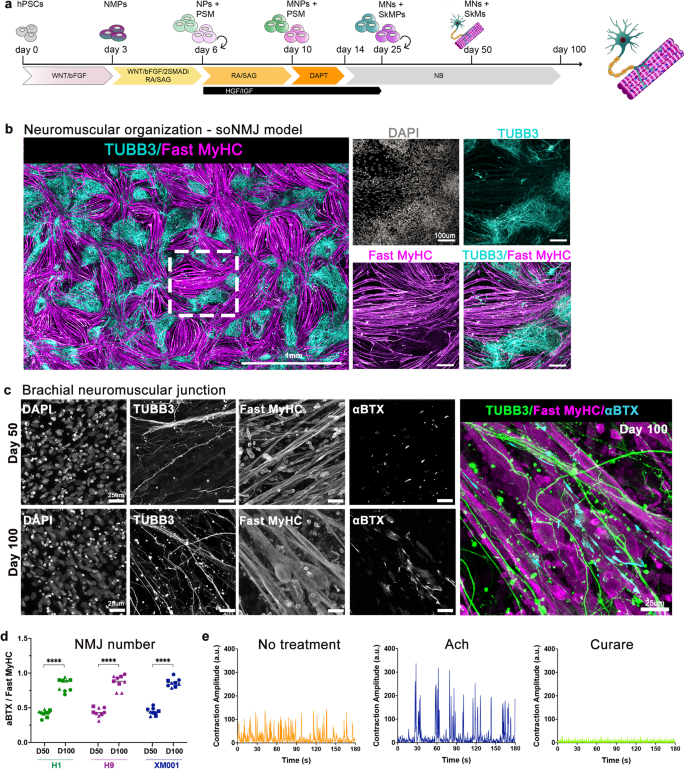
a Schematic illustration of the strategy used to generate the soNMJ model from hPSCs under adherent culture conditions. b High-content imaging of whole well at day 50 soNMJ model. The representative image depicts the self-organization of the neurons TUBB3+ (cyan) and skeletal muscle fibers that express Fast MyHC (magenta) in 20 fields acquired in the same well. Scale bars: 1 mm and 100 µm. H1: N = 1; H9: N = 1; XM001: N = 1. c Representative immunofluorescence image at day 50 and day 100 of differentiation showing the presence of TUBB3+ neurites in contact with α-bungarotoxin+ (αBTX+) AChR clusters on fast-twitch skeletal muscle fibers (Fast MyHC+) revealing the presence of neuromuscular junctions. Scale bars: 25 µm. d Quantification of the number of αBTX clusters at day 50 and day 100 of hPSC differentiation normalized to the number of Fast MyHC myofibers. The number of NMJs increased significantly from day 50 (H1: 0,419 ± 0,048; H9: 0,435 ± 0,067; XM001: 0,447 ± 0,051) to day 100 (H1: 0,832 ± 0,09; H9: 0,872 ± 0,099; XM001: 0,861 ± 0,059). The statistical tests employed included unpaired t-test with Welch’s correction. *P ≤ 0.05; **P ≤ 0.01; ***P ≤ 0.001; ****P ≤ 0.0001. Each dot with the same colour/shape represents the number of NMJs in a well from a single differentiation experiment of a specific cell line. The different colours correspond to different cell lines and the different shapes to different experiments (N). H1: N = 3, n = 9; H9: N = 3, n = 9; XM001: N = 3, n = 9. Source data are provided as a Source Data file. e At day 100 of differentiation, there was a spontaneous contraction of the skeletal muscles. Contraction analysis by live imaging showed that muscle contraction was increased by administering 10 μM acetylcholine and blocked by adding the acetylcholine receptor inhibitor, curare (10 μM). H1: N = 3, n = 9; XM001: N = 9, n = 27. soNMJ: self-organizing neuromuscular junction. Source data are provided as a Source Data file.
High-content imaging reveals the self-organization of spinal cord neurons and skeletal muscles to form maturing neuromuscular junctions
Neuromuscular cultures were very dense by day 20 (Supplementary Fig. 5a), and we assessed whether cells would maintain their self-organizing capacity after passaging. Cultures were analyzed at day 50 using a high-content imaging system that allowed us to capture the whole culture dish. Immunofluorescence analysis with Myosin skeletal fast (Fast MyHC) and TUBB3 revealed the organization of skeletal myofibers in bundles surrounded by spinal cord neurons that could be maintained in culture for more than 100 days (Fig. 3a, b). 3D projection of the neuromuscular images revealed that, along the z-axis, the muscles and neurons were also segregating on different layers (Supplementary Movie 1), confirming that this is a self-organizing NMJ (soNMJ) model.
It was recently shown that skeletal myofibers self-organized in bundles instructed by mechanical tension in 2D cultures33. Still, in those cultures, the contraction of the skeletal muscles could not be maintained for too long due to loss of attachment. An important advantage of the soNMJ model is that muscles remained attached to the dish for long periods, even under contractile conditions (Supplementary Fig. 5a, c), probably due to the support that they received from the spinal cord neurons and glia cells. At day 50, we detected numerous acetylcholine receptor (AChR) clusters by staining for α-bungarotoxin (αBTX) contacted by TUBB3+ neurites, suggesting the formation of NMJs. To address the reproducibility of the soNMJ model, we analyzed the number of NMJs contacted by TUBB3+ neurites in three different PSC lines at day 50 and day 100 (Fig. 3c, d). The number of NMJs was similar among the different lines at day 50 when normalized to the total number of muscle fibers. In agreement with a stepwise, ongoing maturation, the number and size of the NMJs significantly increased from day 50 to day 100 (NMJs length >5 μm) (Fig. 3c, d and Supplementary Figure 5d). At day 100, the skeletal muscle fibers were multinucleated and had the typical striation of sarcomere organization (Supplementary Fig. 5b, Supplementary Fig. 6a, 6b). A characteristic of mature myofibers is the presence of PAX7+ muscle stem cells, also known as satellite cells. At day 100, we observed PAX7+ cells underneath the basal lamina-like area, an arrangement reminiscent of satellite cells in vivo34 (Supplementary Fig. 5e and Supplementary Movie 6). Electron microscopy revealed the development of organized skeletal muscle exhibiting aligned sarcomeric units, mitochondria, t-tubules, and membrane folding with surrounding basal membrane and invagination sites with many caveolae (Supplementary Fig. 6a-e). The presence of synaptic vesicles in the presynaptic neuron further supported the formation of functional synapses (Supplementary Fig. 6f, g). Apart from MNs and skeletal muscles, terminal Schwann cells are necessary for the maturation and stability of NMJs34. Among the different cell types originating from NMPs, there are trunk neural crest cells35 that generate terminal Schwann cells. Thus, we assessed the presence of terminal Schwann cells in the soNMJ culture using the expression of the S100β epitope at the NMJ. At day 50, S100β+ Schwann cells were already present and by day 100, they could be found at the NMJs (Supplementary Fig. 5f and Supplementary Movie 7).
Collectively, these data suggested that brachial MNs interacted with the skeletal myofibers to form NMJs supported by terminal Schwann cells. The increase in the number and size of the NMJs over time, as well as the presence of multinucleation and striation in the myofibers, suggested that the neuromuscular model matured over time. This was further supported by the detection of PAX7+ satellite-like cells and S100β+ terminal Schwann cells.
Functional analysis of the soNMJ model
To investigate the functionality of the soNMJs, we analyzed the contractile muscle activity at day 75 after treatment with 10 μM acetylcholine and after treatment with 10 μM curare, which is a blocker of the AChR (Supplementary Movie 2). Treatment with acetylcholine increased the amplitude of muscle contraction. In contrast, treatment with curare blocked the contraction of the skeletal muscles (Fig. 3e). We further characterized the activity of the neuromuscular cultures using calcium imaging and optogenetic stimulation. To record the calcium activity, we used the ratiometric fluorescent calcium-binding dye Fluo8. Calcium transients were observed in spinal neurons and skeletal muscles that were distinguishable by speed and morphology (Fig. 4a and Supplementary Movie 3). Treatment with curare abolished the calcium activity in the skeletal muscles without affecting the firing of the neurons (Fig. 4a and Supplementary Movie 3).
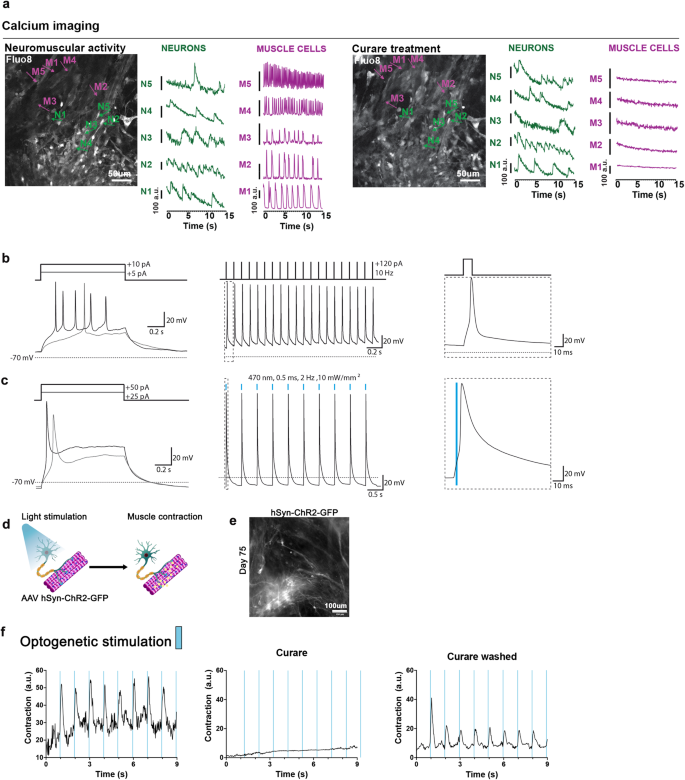
a The neuromuscular cultures were incubated with Fluo8-AM at day 75 for visualizing calcium transients with a spinning disk confocal microscope. Representative frames are shown for both spontaneous and 10 µM curare conditions. Individual neurons and muscle cells were identified by their morphology, and their calcium transients were plotted separately. Administration of 10 μM curare blocked the calcium activity in the skeletal muscle fibers but not in the neurons, supporting that the muscle contraction was driven by the neurons through the NMJs. Scale bars: 50 µm. H1: N = 2; XM001: N = 1. Source data are provided as a Source Data file. b Current clamp recording from a neuron transduced with an AAV encoding hSYN:NLS-GFP to label neuronal nuclei. The static current injection caused spontaneous action potential firing, while 10 Hz stimulation with brief square pulses revealed the potential for the repetitive firing of the neurons. Inset shows the first action potential. c Current clamp recording from a neuron transduced with an AAV encoding hSYN:ChR2(H134R)-GFP. The neuron reliably fired action potentials in response to 0.5 ms blue light (470 nm) flashes delivered at 2 Hz. Inset shows the first light-evoked action potential. d schematic representation of the optogenetic experiments. Neurons transduced with an AAV encoding hSYN:ChR2(H134R)-GFP were stimulated with blue light to drive the contraction of the skeletal muscle cells. e Immunofluorescence image of day 75 soNMJ culture model showing neurons expressing ChR2-GFP 3 weeks post-transduction with an AAV encoding hSYN:ChR2(H134R)-GFP. Scale bars: 100 µm. H1: N = 1; XM001: N = 2. Source data are provided as a Source Data file. f Optogenetic analysis of the soNMJ model at day 75. Every stimulation of ChR2-GFP+ neurons by 470 nm light pulse resulted in the concomitant contraction of the skeletal muscle cells. Exposure to 10 μM curare blocked the neural transmission at the NMJs resulting in the inhibition of muscle contraction even upon optogenetic stimulation. The muscle contraction response to blue light stimulation of the neurons was restored by washing out curare.
To check the functionality of the spinal neurons, we performed patch-clamp recordings of the electrical activity. Neuronal somata were visualized by AAV-mediated neuron-specific expression of nucleus-targeted EGFP. Neurons had a resting membrane potential of −61.94 ± 5 mV (n = 5, corrected for liquid junction potential) and a low capacitance (18.72 ± 1.37 pF). Injection of 1-s long depolarizing currents elicited single or multiple action potentials (Fig. 4b), demonstrating functional neuronal physiology. Moreover, repetitive injections of short (10 ms) depolarizing currents at 10 Hz reliably elicited trains of action potentials (Fig. 4b). In ChR2-expressing neurons, we found that very brief light flashes could elicit similar repetitive firing (Fig. 4c). To obtain optogenetic control of neuronal firing, we transduced day 50 cultures with an adeno-associated virus (AAV) in which the expression of Channelrhodopsin2 (ChR2)-GFP is under the control of the human SYNAPSIN promoter. After 3-4 weeks, we performed whole-cell current clamp recordings on ChR2-GFP-expressing neurons, and found that trains of brief light flashes could elicit repetitive firing (Fig. 4c). The selective expression of ChR2 in spinal neurons allowed us to optogenetically stimulate synchronous neuronal firing, and thus to test for light-induced muscle contraction driven by synaptic transmission (Fig. 4d). At day 75, spinal neurons showed robust ChR2-GFP expression (Fig. 4e). Light stimulation of these cultures instructed the synchronous contraction of the skeletal muscles providing concrete evidence of controllable NMJ function. The addition of curare blocked the optogenetic stimulation of the skeletal muscles, further supporting our findings (Fig. 4f, Supplementary Movie 4).
The analysis revealed the presence of spinal cord neurons and skeletal muscles forming functional networks. This defined protocol takes advantage of the co-development of the neural and mesodermal lineages and their self-instructing and self-organizing attributes. The result is an efficient and robust platform for rapidly generating hPSC-derived functional soNMJs in 2D that could be used for disease modeling and high throughput studies.
The soNMJ model as a platform to study spinal muscular atrophy
Spinal muscular atrophy (SMA) is a disease mostly caused by deletions in the SMN1 gene locus that lead to reduced levels of SMN protein36. While humans carry nearly identical copies of the SMN1 gene (SMN2) on the same chromosome, a base change in a splice site in exon 7 leads to insufficient expression of the full-length transcript37. SMN2 exists in a variable number of copies (2-8), which determines the severity of the disease38. SMA has been initially considered a MN-specific disease, but animal studies suggested an earlier effect at the NMJ and skeletal muscle39,40,41,42,43. Notably, the loss of the MN population usually only occurs at the end stages of the disease, and it might be a consequence of structural and functional defects at the NMJs that are the earliest pathological changes detected in SMA mouse models44,45,46,47.
To provide a proof of concept for our soNMJ model, we used human induced pluripotent stem cells (hiPSCs) from two patients (SMA pt1, SMA pt2) with SMA to generate soNMJs (Fig. 5a). Both patients had a severe form of type 1 SMA with only two copies of SMN2. Due to the high presence of repetitive elements in the genomic locus of SMN1, it was not possible to target the deleted sequence to generate an isogenic line and thus we compared them to well-characterized control PSC lines. Both patient iPSC lines were first analyzed for the expression levels of SMN protein by immunofluorescence and western blotting, which revealed a reduction in SMN protein levels compared to the control (Supplementary Fig. 7a, 7b).
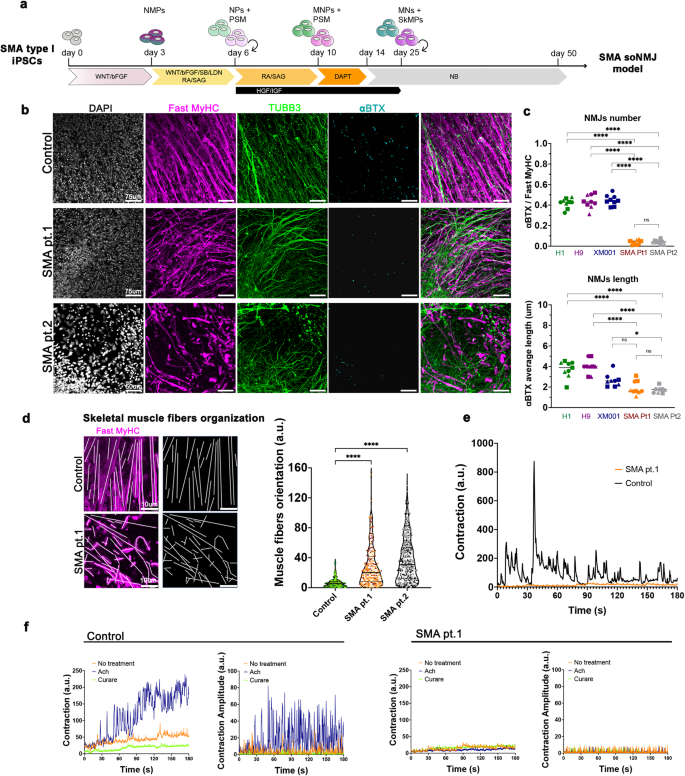
a Schematic illustration of the soNMJ differentiation from SMA type I hiPSCs. b Representative images of αBTX clusters in SMA iPSC derived soNMJs and control at day 50 of differentiation. Scale bars: 75 µm. c Quantifications at day 50 of the αBTX+ clusters revealed a significant reduction in the number and size of αBTX clusters in the SMA type I soNMJ cultures compared to H1, H9, and XM001 control lines. The statistical tests employed included one-way ANOVA with Bonferroni’s multiple comparison test. *P ≤ 0.05; **P ≤ 0.01; ***P ≤ 0.001; ****P ≤ 0.0001. Each dot with the same colour/shape represents the number of NMJs in a well from a single differentiation experiment of a specific cell line. The different colours correspond to different cell lines and the different shapes to different experiments (N). H1: N = 3, n = 9; H9: N = 3, n = 9; XM001: N = 3, n = 9; SMA pt.1: N = 3, n = 9; SMA pt.2: N = 3, n = 9. d Immunofluorescence analysis using Fast MyHC marker at day 50 showed compromised skeletal muscle fiber organization in the two SMA type I hiPSC lines compared to H1 hPSC control. Results are shown as the angle of deviation of each individual fiber from the average fiber orientation. H1: N = 3, n = 9; SMApt1: N = 3, n = 9; SMApt2 N = 3, n = 9. Scale bars: 10 µm. e Skeletal muscle contraction was impaired in SMA type I compared to XM001 control hiPSC line at day 50 of differentiation. H1: N = 3, n = 9; XM001: N = 3, n = 9; SMA pt1: N = 3, n = 9. f Muscle contraction analyzed in SMA type I at day 50 did not respond to 10 μM acetylcholine and 10 μM curare administration compared to H1 hPSC control line. hiPSCs: Human induced pluripotent stem cells; soNMJ: self-organizing neuromuscular junction.
We further used the SMA lines to generate soNMJs in vitro through an NMP intermediate state (Supplementary Fig. 7c, 7d). The SMA neuromuscular cultures were analyzed at the progenitor (day 20) and mature state (day 50) for the presence of neural and muscle-specific progenitor cells and the formation of NMJs (Supplementary Fig. 7e and Fig. 5b). At day 20, DESMIN+ myoblast cells and SOX1+ NPs were detected in both the SMA type 1 and control hPSC lines (Supplementary Fig. 7e). However, at this stage, SMA myofibers were already smaller and less elongated in the SMA type 1 derived soNMJs (Supplementary Fig. 7e). This suggested a delay in the differentiation and maturation of the skeletal muscle cells. At day 20, ChAT+ MNs were also present in both SMA and control cultures but without detectable morphological differences (Supplementary Fig. 7f). This suggested that the MNs were not affected at this point.
Next, we analyzed the cells at day 50 for the presence of mature Fast MyHC+ skeletal myofibers and TUBB3+ neurons (Fig. 5b). At this stage, the SMA muscle cells were smaller and showed reduced elongation and organization (Fig. 5b). Additionally, at day 50, SMA myoblasts generated Fast MyHC+ myofibers that were reduced in length, disorganized, pointing at different directions instead of aligning, and failing to form bundles (Fig. 5d). These results strongly suggested an impaired maturation of the skeletal muscle cells in SMA. We further performed high-throughput analysis of the SMA and control line in 96-well formats and quantified the total muscle (Fast MyHC) and neural area (TUBB3) (Supplementary Fig. 8a). The analysis confirmed the significant reduction in the muscle area while we could not observe an effect in the neural area at this stage (Supplementary Fig. 8b, 8c). Detailed analysis of the MN area with the neurofilament marker SMI32 revealed that there was no significant difference between the SMA and control line (Supplementary Fig. 8d, 8e).
Synaptic defects at the NMJs are one of the hallmarks of SMA pathology44. We analyzed the presence of AChR clusters to investigate whether this phenotype was reproduced in the SMA soNMJ model. Quantification of the αBTX+ clusters showed that, in SMA, NMJs were significantly reduced in number and size compared to the hPSC lines H9, H1 and XM001 (Fig. 5b, c). Analysis of muscle contraction showed the presence of short-duration weak movements in individual muscle fibers, followed by exhaustion and a complete lack of activity. Thus, the contractility of the SMA skeletal myofibers was severely impaired (Fig. 5e, Supplementary Movie 5). We subsequently tested if the addition of acetylcholine would stimulate the muscle contraction and whether the administration of curare would block the spontaneous residual muscle contractility. Acetylcholine administration did not stimulate contraction, whereas curare failed to stop spontaneous muscle activity, suggesting the lack of functional NMJs in the SMA model (Fig. 5f, Supplementary Movie 5). Light stimulation at day 50 failed to instruct the synchronous contraction of the skeletal muscles providing concrete evidence of a functional defect (Supplementary Fig. 8f, Supplementary Movie 8).
Collectively, these data revealed an early muscle-specific phenotype and an apparent impairment in the formation of synapses between the motor neuron endplates and the skeletal muscle in SMA prior to motor neuron cell death. Thus, the soNMJ model provides unique opportunities for mechanistic studies that will elucidate the sequence of events leading to neuromuscular diseases in humans.
- SEO Powered Content & PR Distribution. Get Amplified Today.
- PlatoData.Network Vertical Generative Ai. Empower Yourself. Access Here.
- PlatoAiStream. Web3 Intelligence. Knowledge Amplified. Access Here.
- PlatoESG. Carbon, CleanTech, Energy, Environment, Solar, Waste Management. Access Here.
- PlatoHealth. Biotech and Clinical Trials Intelligence. Access Here.
- Source: https://www.nature.com/articles/s41467-023-43781-3