Optimized BROTHERS architectures mitigate hepatotoxicity without affecting antisense activity
A proof-of-concept study was first conducted with mPCS1 ASO (Table 1), a fully PS-modified 14-mer LNA gapmer with two phosphodiester-linked GalNAcAPD units, which are the liver-targeting N-acetylgalactosamine ligands previously developed by our group43,44, on its 5’-terminal. mPCS1 targets the murine Pcsk9 (Proprotein convertase subtilisin kexin 9) mRNA, a well-known hypercholesterolemia target, but does not cover its human ortholog.
Through in-house screening, this ASO was identified to have good knockdown activity; however, it developed dose-dependent moderate hepatotoxicity, typical in the LNA gapmer class of ASOs. At a dose of 100 nmol/kg, mPCS1 achieved 68% knockdown of hepatic Pcsk9 mRNA in C57BL/6 J mice at 72 h after a single subcutaneous administration; however, a significant increase in the liver transaminase level was observed (Fig. 2a, b). To determine the effect of complementary BS on antisense activity and hepatotoxicity, we prepared four antiparallel-type PNA strands of different lengths and positions: PNA(12), PNA(11), PNA(10), and PNA(C8) (Table 1). As shown in Fig. 2a, the thermodynamic stability of the ASO/PNA BRO duplex, expressed as the melting temperature (Tm), increased as the length of BS increased. Consequently, we observed a consistent decrease in the knockdown activity as the BS length increased. Of note, this trend in activity may not only be due to the stability of the BRO duplex but also the size of the toehold domain.
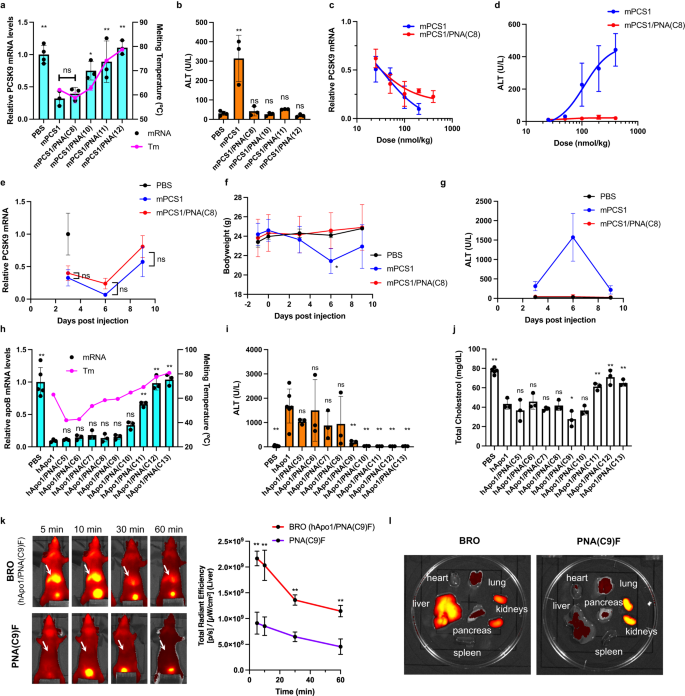
a, b Each mouse (C57BL/6 J, male, n = 4 biologically independent samples for control, n = 3 for mPCS1 and BRO series) was subjected to a single subcutaneous injection of each Pcsk9-targeted drug (ssASO and varied BROs) at a dose of 100 nmol/kg and evaluated 72 h after administration. Hybridization melting temperature (Tm) (n = 3 independent experiments) and Pcsk9 mRNA expression (one-way ANOVA followed by two-sided Dunnett’s multiple comparison tests comparing to mPCS1, p values from left side; 0.0007, 0.9728, 0.0318, 0.0050, 0.0003) (a). ALT levels (one-way ANOVA followed by two-sided Dunnett’s multiple comparison tests comparing to PBS, p values from left side; <0.0001, 0.9737, >0.9999, 0.9982, 0.9999) (b). c, d Dose dependence of knockdown activity (c) and hepatotoxicity (d) was evaluated for mPCS1 ssASO and mPCS1/PNA(C8) BRO using the same single-dose experiment in mice (n = 4 biologically independent samples for mPCS1 at a dose of 400 nmol/kg, n = 3 for other treatment groups). e–g Long-term effects of knockdown activity (n = 3 biologically independent samples) (e), body weight change (n = 3 biologically independent samples for control, n = 6 for mPCS1 and BRO at day −1, 0 and 3, n = 3 for mPCS1 and BRO at day 6; two-way ANOVA followed by two-sided Dunnett’s multiple comparison tests comparing to PBS, 0.0283 mPCS1 at Day6) (f), and toxicity (n = 4 biologically independent samples for control, n = 3 for mPCS1 and mPCS1/PNA(C8)) (g) after a single administration were compared and evaluated. h–j BSOs with various lengths of the BS using ASOs against different target, apolipoprotein B (apoB), were prepared. Their Tm (n = 3 independent experiments), apoB mRNA knockdown activity (n = 5 biologically independent samples for control, n = 3 for hApo1 and BRO series; one-way ANOVA followed by two-sided Dunnett’s multiple comparison tests comparing to hApo1, p values from left side; <0.0001, >0.9999, 0.9966, 0.9188, 0.9992, 0.9909, 0.0729, <0.0001, <0.0001, <0.0001) (h), ALT values (n = 9 biologically independent samples for control, n = 6 for hApo1, n = 3 BRO series; one-way ANOVA followed by two-sided Dunnett’s multiple comparison tests comparing to hApo1, p values from left side; 0.0001, 0.5406, 0.9998, 0.2833, 0.3758, 0.0037, 0.0013, 0.0012, 0.0012, 0.0012) (i), and total cholesterol levels (n = 5 for control PBS, n = 3 for hApo1 and BRO series; one-way ANOVA followed by two-sided Dunnett’s multiple comparison tests comparing to hApo1, p values from left side; <0.0001, 0.6980, 0.9994, 0.8870, >0.9999, 0.0269, 0.6741, 0.0096, <0.0001, 0.0016) (j) were compared with their parent ssASO (hApo1) in mice dosed at 100 nmol/kg at 72 h after injection. k–l Pharmacokinetics and biodistribution of fluorescently labeled complementary PNA(C9)F were evaluated under two conditions: in vivo (n = 3 biologically independent samples; two-way ANOVA followed by two-sided Bonferroni’s multiple comparisons test, p values from left side; <0.0001, <0.0001, 0.0004, 0.0006) (k) and ex vivo (at 5 min post-dose) (n = 1) (l); one in the configuration of a BRO duplex and one administered alone. Arrows indicate the liver. All data are presented as mean values ± SD. **p < 0.01, *p < 0.05. “ns” indicates not significant (p > 0.05). Source data are provided as a Source Data file.
The effect of BS on the hepatotoxicity of mPCS1 ASO was remarkable, completely suppressing the increase in ALT levels in all treatment groups (Fig. 2b). In particular, mPCS1/PNA(C8) BRO significantly suppressed abnormal ALT elevations to normal levels while maintaining the activity of the parent mPCS1 ssASO. Accordingly, BS screening can yield clinically relevant BROs with superior efficacy and safety. The Tm values were closest to each other for mPCS1/PNA(10) and mPCS1/cRNA(14), whereas that of the mPCS1/PNA(C8) duplex was slightly smaller. This result suggests that the affinity balance between the BRO duplex and ASO/mRNA is of particular importance. The effective doses that reduced the Pcsk9 mRNA by 50% (ED50) in the liver for mPCS1 and mPCS1/PNA(C8) BRO were 35.3 nmol/kg and 21.7 nmol/kg, respectively (Fig. 2c). As shown in Fig. 2d, dose-dependent ALT elevation was pronounced in the mPCS1-treated arm, while BRO consistently prevented ALT elevation, even at 400 nmol/kg. Thus, the BRO technology can significantly improve the therapeutic margins of ASOs.
To examine the potential hepatotoxicity upon BS dissociation at any later timeframe, we evaluated the antisense activity and toxicity parameters over a longer period after a single 100 nmol/kg administration to C57BL/6 J mice. Ten days of follow-up analysis revealed no predominant difference in knockdown activity between mPCS1 and its BRO counterpart. Further, both systems showed a trend toward the recovery of Pcsk9 mRNA expression by day 9 (Fig. 2e). In contrast, the mPCS1-treated arm displayed a marked decrease in body weight and the highest ALT levels on day 6, both of which showed a trend toward recovery up to day 9. Throughout this period, there was no change in body weight or abnormal elevation in ALT levels in the BRO-treated arm (Fig. 2f, g).
The versatility of the BRO strategy was further investigated by employing another LNA gapmer with a different sequence from mPCS1. This LNA gapmer was hybridized to form an ASO/PNA duplex in combination with a more systematically designed set of BS. Thereafter, structure-activity/toxicity relationship studies were conducted. hApo1 is a 2-8-3 fully PS-modified LNA gapmer that targets a consensus sequence in the human and mouse apolipoprotein B (apoB) mRNA (Table 1). Similar to mPCS1, the hApo1 ASO possesses two phosphodiester-linked GalNAcAPD units at the 5′ end. In this study, nine different BS ranging from 5 to 13 bases in length, all covering the 5′ end of the ASO, were tailored.
The Tm values of these nine PNAs versus ASOs ranged from 42 °C to 81 °C, showing a reasonable propensity to increase binding affinity as a function of PNA length (Fig. 2h). The Tm of hApo1/cRNA(13) was 63 °C, which was between that of PNA(C9) and PNA(C10). To assess the antisense activity and hepatotoxicity of this series of BROs, a single subcutaneous injection of 100 nmol/kg was administered to C57BL/6 J mice, and the following analyses were performed 72 h post-dosing. Figure 2h shows a comparison of the expression levels of apoB mRNA in the liver. Compared to hApo1 ssASO, no statistically significant difference in apoB mRNA levels was found for PNA(C5) to PNA(C9)-based BROs, which exhibited high knockdown activity. In contrast, as the strand length increased, a clear decrease in activity was observed from PNA(C10) to PNA(C13). This trend also supports the importance of the binary effects of the binding affinity of BS and the toehold length of BRO, implying the significance of BS detachment from ASO at the appropriate time.
Regarding side effects, hApo1 displayed more severe ALT elevation than mPCS1. BROs ranging from hApo1-PNA(C5) to -PNA(C8) had a limited impact on normalizing ALT levels and could not sufficiently suppress hepatotoxicity. In contrast, BROs longer than PNA(C9), the Tm of which is close to that of the target RNA compared to hApo1, significantly prevented abnormal ALT elevation. Overall, hApo1/PNA(C9) BRO is one of the best combinations that exhibit ALT values in the normal range while maintaining high knockdown activity. This result was also revealed by the effective reduction in blood cholesterol, which was acutely induced by apoB knockdown (Fig. 2j). Taken together, our BROTHERS approach has proven to be a robust approach that can reasonably and easily eliminate the liver toxicity often observed with this class of agents.
BS circulates alongside ASO in the blood or is otherwise excreted rapidly
To confirm whether the optimized BRO complexes circulated in the blood and were delivered to the target liver as a duplex, an in vivo fluorescent imaging experiment was performed. In particular, C-terminal Cy5-conjugated PNA(C9)F was prepared (Table 1), and its biodistribution was evaluated and compared in vivo when intravenously administered as a double strand (with hApo1) or a single strand. When administered as a BRO duplex, PNA(C9)F mainly accumulated in the liver at the 5-min initial acquisition (Fig. 2k). Subsequently, the fluorescence in the liver slowly faded, as revealed by the 1-h follow-up. This pharmacokinetic property is very similar to that of GalNAc-conjugated PS ASOs, as previously demonstrated by our group44,45. On the other hand, PNA(C9)F per se did not exhibit strong fluorescence that spread throughout the body, as observed with BRO, even immediately after administration, but was excreted in urine very quickly. Moreover, fluorescence was hardly observed after 1 h.
In a separate experiment, 5 min after administration, mice were killed, their organs were excised, and the fluorescence intensity in each organ was compared (Fig. 2l). In this ex vivo experiment, PNA(C9)F administered as BRO was found to mainly accumulate in the liver, followed by the kidneys. Single-stranded PNA(C9)F was hardly detected outside the kidneys, implying that PNA itself has a small volume of distribution, which is the characteristic being sought with BS. Overall, these pharmacokinetic/biodistribution analyses revealed that optimized BRO circulates in the blood as a duplex and is transported to the liver very early.
BRO significantly attenuates changes in gene expression caused by toxic ssASO
We performed RNA sequencing (RNA-Seq) analysis to assess the molecular impact of BS on ASO toxicity. C57BL/6 J mice were subcutaneously treated with 100 nmol/kg of either mPCS1 or mPCS1/PNA(C8) BRO, and global gene expression in the liver was evaluated 72 h post-treatment. We selected day 3 for RNA-seq analysis because, according to Fig. 2e–g, the toxicity of ssASO was the strongest on day 6, and RNA-seq analysis should be performed at the earlier stages of toxicity. The number of differentially expressed genes (DEGs) was approximately 75% lower in the BRO-treated arm than in the ssASO-treated arm (Fig. 3a). In addition, as depicted in the MA plots, the large deviation in the overall gene expression by mPCS1 ssASO was attenuated in the BRO-treated arm (Fig. 3b, c). To express the total number of mismatches and insertions or deletions between ASO and complementary RNA sequences, we used the value “distance (d),”46 and color-coded the genes showing each d value (Supplementary Table 1).
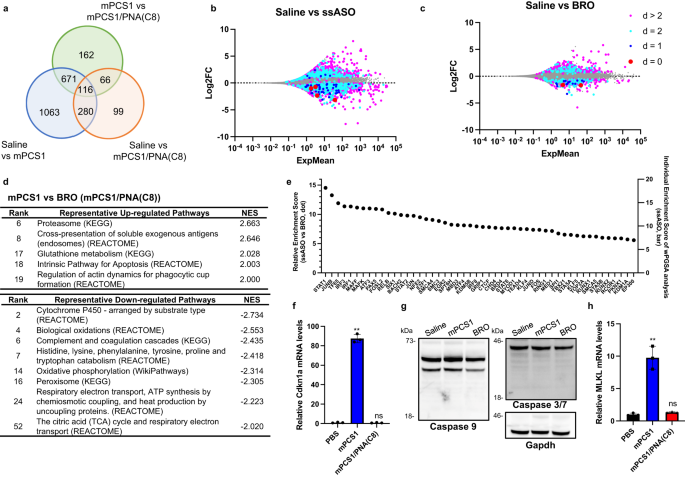
a RNA-seq analysis of the liver of C57BL/6 J mice treated with either mPCS1 or mPCS1/PNA(C8) BRO subcutaneously at 100 nmol/kg at 72 h after injection. Number of differentially expressed genes (DEGs) in each treatment group (n = 2 biologically independent samples). b, c MA plots of RNA-seq data with DEGs color-coded according to d-values. d GSEA analysis derived from comparison of mPCS1 vs mPCS1/PNA(C8) (Supplementary Data 2). e top 50 transcription factors predicted to be particularly active in ssASO over BRO using weighted parametric gene set analysis (wPGSA) analysis based on the RNA-seq data. f, h The relative mRNA expression of Cdkn1a and Mlkl in the livers of C57BL/6 J mice treated with either mPCS1 or mPCS1/PNA(C8) BRO subcutaneously at 400 nmol/kg at 72 h after injection. (n = 3 biologically independent samples; one-way ANOVA followed by two-sided Dunnett’s multiple comparison tests comparing to PBS, Cdkn1a: p < 0.0001 mPCS1, p = 0.9921 BRO, Mlkl: p < 0.0001 mPCS1, p = 0.8936 BRO). g The western blotting analysis of the caspases in the livers. Shown is a representative result taken from 3 independent experiments. **p < 0.01, *p < 0.05. “ns” indicates not significant (p > 0.05). Data in (f, g) are presented as mean values ± SD. Source data are provided as a Source Data file.
For d ≤ 2, 782 DEGs were detected in the ssASO-treated group, of which 67% exhibited repressed expression. In contrast, only 205 DEGs were observed in BRO, with only 60% being downregulated. For d > 2, 49% of the 1361 DEGs in the ssASO group were assigned to suppressed expression, while 38% of the 357 DEGs in the BRO group were classified as suppressed. The number of DEGs and downregulated DEGs was markedly reduced by BRO implementation. The larger fraction of DEGs downregulated for d ≤ 2 compared to d > 2 could be due to a hybridization-dependent off-target knockdown; however, the hybridization-independent mechanism may also be involved, as a significant number of genes were upregulated at each d value.
A comparison of the gene expression profiles between ssASOs and BRO may reveal how BRO suppresses hepatotoxicity. Thus, we performed gene set enrichment analysis (GSEA) of DEGs. The activation of pathways related to proteasome proteolysis and glutathione (GSH) metabolism was observed (Fig. 3d). In contrast, biochemical reactions that generate reactive oxygen species (ROS), such as drug metabolism pathways, biological oxidative pathways, respiration, and oxidative phosphorylation, were widely attenuated by ssASO treatment (Fig. 3d). To further illustrate the detailed mechanisms of the reduced hepatotoxicity of BRO, we employed weighted parametric gene set analysis (wPGSA) to predict the activity of the transcription factors (TFs) from the transcriptome data obtained47.
Figure 3e shows a list of TFs suggested to be specifically activated by ssASO rather than BRO and their relative and individual Enrichment Scores. Highly activated TFs include STAT1, STAT2, and IRF3, which are responsible for innate and acquired immune responses and host defenses against infection. IRF1 also regulates the transcription of interferon (IFN) and IFN-inducible genes, which are responsible for immunity, inflammation, cell proliferation and differentiation, and programmed cell death, following DNA damage. TF65/Rela and Relb are known to play important roles in inflammation, immunity, differentiation, cell proliferation, and apoptosis. Further, small Mafs are essential for oxidative stress response. In response to DNA damage or other cellular stresses, Cdkn1a/p21 can be induced to arrest the cell cycle for DNA repair or apoptosis if damage cannot be repaired.
The upregulation of Cdkn1a (Fig. 3f) indicated the involvement of apoptosis; however, no detectable activation of caspases related to apoptosis was observed (Fig. 3g). In contrast, the upregulation of Mlkl (mixed lineage kinase domain-like protein) indicates the involvement of necroptosis, a form of programmed cell death that occurs when apoptosis is blocked (Fig. 3h). Mlkl is a protein that plays a critical role in necroptosis48. Further research is needed to understand the role of Cdkn1a and Mlkl in regulating the balance between apoptosis and necroptosis. Overall, these results suggest that cellular damage may be the result of immune and/or metabolic responses to foreign invasion and/or intracellular stresses, such as drug-induced perturbations of homeostasis.
ssASO stimulates cell death pathways, while BRO does not stimulate such pathways
Owing to the in vivo RNA-Seq analysis, we opted to focus on the potential of BRO to suppress innate immune receptor activation and/or reduce hybridization-independent interactions that generate ROS. ROS are produced by mitochondrial oxidative metabolism and cellular responses to xenobiotics and cytokines. ROS are also intriguing regulators of cell death49. To further examine the molecular mechanisms by which BRO selectively removes ssASO toxicity, in vitro evaluation was deemed important. However, a major challenge for the current in vitro systems is the ability to recapitulate and predict the in vivo toxicity of ASOs using common cultured cell lines as a surrogate for cumbersome “in vivo” screening assays23. One non-native aspect of culture systems is the high reliance on glycolysis for cellular ATP production rather than the mitochondria, a phenomenon known as the Warburg effect. Under such conditions, the pivotal roles of the mitochondria, such as ROS production and cell death induction, are compromised, and cells are more tolerant against toxicants50,51. Supplementation of galactose in the culture medium, instead of glucose, is known to shift the metabolism to mitochondrial ATP production, reproducing in vivo-like conditions. We hypothesized that the ASO toxicity observed in vivo could be evaluated under such particular culture conditions if a common intracellular toxicity mechanism exists.
Previously, we developed a transfection method that better reflects the in vivo activity of ASO, called the calcium-enrichment in culture medium (CEM) method45,52. To develop a more sophisticated transfection method to predict toxicity and activity based on the CEM method, the cells were incubated for 2–5 days in the presence of either 2 µM mPCS1n ssASO or mPCS1n/PNA(C8) BRO in a modified CEM condition (9 mM CaCl2 and 10% FBS with 10 mM galactose, without glucose) (Fig. 4a). Loading ssASO under the modified CEM condition led to the display of cytotoxicity after 2 days. Moreover, after 72 h, the number of cells decreased, and propidium iodide (PI)-positive cells increased (Fig. 4b).
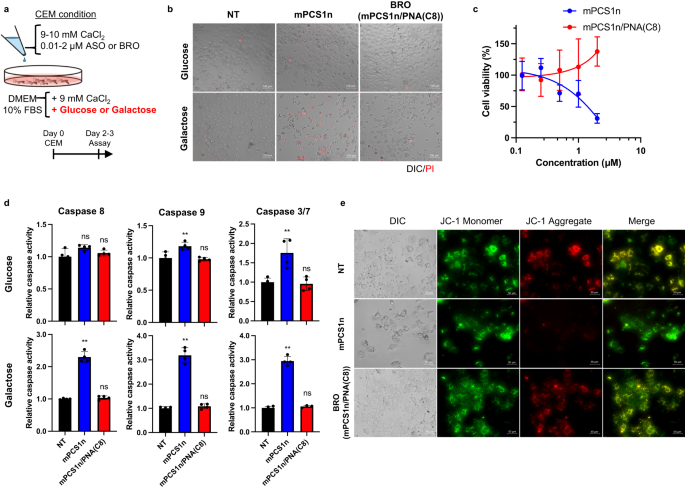
a Procedure for evaluation of cytotoxicity of mPCS1n ssASO and mPCS1n/PNA(C8) BRO in original and galactose-modified media. b PI staining of Huh-7 cells exposed to 2 µM mPCS1n ssASO and mPCS1n/PNA(C8) BRO after 48 h of CEM transfection (n = 3 biologically independent samples). c Drug concentration-dependent assessment of cell viability (n = 5 biologically independent samples) d Activity of caspases 3/7, 8, and 9 (n = 4 biologically independent samples; one-way ANOVA followed by two-sided Dunnett’s multiple comparison tests comparing to control, p values from left side; glucose conditions: 0.0674, 0.5360 for caspase 8; 0.0077, 0.9104 for caspase 9; 0.032, 0.9571 for caspase 3/7; galactose conditions: <0.0001, 0.8379 for caspase 8; <0.0001, 0.7712 for caspase 9; <0.0001, 0.7933 for caspase 3/7). e the depolarization of the mitochondrial membrane potential (ΔΨm) with JC−1 dye were compared and evaluated for mPCS1n or mPCS1n/PNA(C8) BRO through transfection into Huh-7 cells using the CEM method (n = 1) (e). **p < 0.01, *p < 0.05. “ns” indicates not significant (p > 0.05). Data in Fig. 4c and d are presented as mean values ± SD. Source data are provided as a Source Data file.
Surprisingly, BRO did not exhibit any cytotoxicity under galactose conditions. Cells in glucose medium were markedly less responsive to ssASO toxicity. Figure 4c compares the concentration-dependent cytotoxicity of ssASO and BRO in galactose medium. The cytotoxicity of ssASO occurred in a concentration-dependent manner; however, the cells survived well when administered any concentration of BRO, which is consistent with the observation in vivo (Fig. 2d). The culture conditions that encouraged greater dependence on the mitochondria yielded this phenotypic deviation, prompting us to speculate that ssASO toxicity is mediated via the mitochondrial pathway. Thus, we evaluated the activity of caspases 8 and 9, which are involved in mitochondria-mediated apoptosis (Fig. 4d). Both caspases were moderately but significantly activated by ssASO treatment in the galactose CEM condition, but were not activated by BRO, remaining unchanged.
Among the more downstream apoptotic caspases, ssASO had a more pronounced activating effect on caspase 3/7 under galactose conditions. In contrast, BRO did not mediate the activation of caspase 3/7 under either condition. The depolarization of the mitochondrial membrane potential (ΔΨm) was also examined using JC−1 dye (Fig. 4e). JC−1 aggregation is associated with high ΔΨm, which is indicated by red fluorescence. ssASO, but not BRO, was found to relax ΔΨm, and red fluorescence was no longer observed. Overall, under the in vivo mimetic conditions, BS installation clearly mitigated the inherent cytotoxicity of ssASO, which could be achieved via direct or indirect effects on the mitochondria.
Hybridization-independent mechanism: Complementary PNA strand mitigates non-specific protein interactions and changes the intracellular fate of ASO
To determine how bracing ASO with partially complementary PNA can boost safety, we examined the protein-binding property, which is thought to be one of the origins of the hybridization-independent off-target toxicity of ASOs. Biotin-bound mPCS1b ASOs were immobilized on avidin-coated magnetic beads and exposed to murine liver lysate. Thereafter, the bound protein was pulled down (Fig. 5a). After the binding proteins were eluted competitively, they were fractionated via SDS-PAGE and identified using LC/MS. Gel electrophoresis revealed that BRO bound significantly less amount and type of protein than ssASO (Fig. 5b). Similar experiments with another toxic hApo1 ASO revealed a gradual decrease in protein binding as the length of the PNA increased relative to the single strand (Fig. 5c). Interestingly, a marked decrease in toxicity in vivo and reduced protein binding were observed for those longer than PNA(C9).
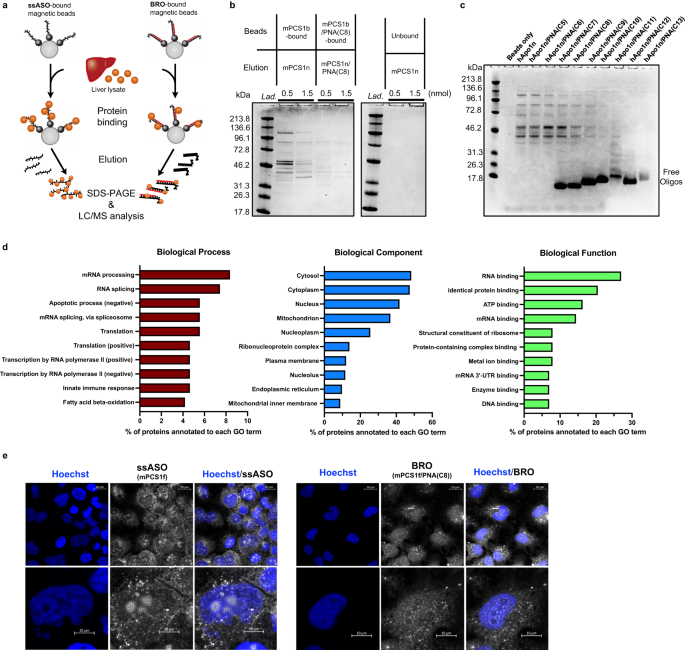
a Schematic illustration of competitive protein pull-down assay, where ASO binding proteins are indicated using colored balls, and biotin tags is indicated by the black circles at the ends of ssASO or BRO. b, c Identification of liver-derived proteins bound by CBB staining for mPCS1b ssASO and mPCS1b/PNA(C8) BRO (n = 3 independent experiments) (b) and for hApo1b and hApo1b/PNA(C5−13) BROs (n = 2 independent experiments) (c). d Classification of identified binding proteins using LC/MS proteomic analysis. e Intracellular localization of Alexa647-labeled mPCS1f or mPCS1f/PNA(C8) BRO visualized using confocal microscopy (n = 2 independent experiments). Source data are provided as a Source Data file.
Most ssASO-binding proteins identified via LC/MS were nucleic acid-binding proteins responsible for homeostasis, cell death, and immune responses (Fig. 5d). To determine the effect of such differences in protein binding characteristics on intracellular dynamics, Alexa647-labeled mPCS1f ASO was transfected into Huh-7 cells as ssASO or the corresponding mPCS1f/PNA(C8) BRO optimized in Fig. 1 using the CEM method, and comparative observations were performed using confocal microscopy. Notably, ssASO displayed a strong signal in the nucleolus, whereas BRO exhibited markedly suppressed localization to the nucleolus (Fig. 5e). This observation suggests that BRO translocates to the cytoplasm as a duplex, and its subcellular localization is altered by binding to proteins that differ from its ssASO counterpart.
Hybridization-dependent mechanism: complementary PNA strand mitigates off-target hybridizations
Next, we asked if BRO indeed undergoes the thermodynamic and kinetic hybridization mechanism depicted in the Introduction, and if BRO thereby suppresses hybridization-dependent off-target knockdown. A key to directly observe the effect of the toehold on the strand exchange/displacement reaction is to prepare and compare structures incorporating toeholds with those that maintain blunt ends on both sides, ensuring equivalent thermodynamic stability. In this context, we here designed and synthesized two types of BS -cGapmer (LNA3) and cGapmer (LNA4)- by integrating different chemistries (DNA, LNA, and PS) (Table 2). Neither of these variants incorporates a toehold but they exhibit similar melting temperatures (Tm) to toehold-bearing PNA(C9).
To compare the susceptibility of these three BROs to the strand exchange reaction, an in-cuvette FRET (fluorescence resonance energy transfer) assay system was devised using TAMRA-labeled hApo1nF and BHQ2-labeled mRNA mimic, ApoB, as shown in Table 2. Specifically, in this system, an equimolar amount of the mRNA mimic was added to each cuvette containing each BRO duplex, and the time-dependent quenching of TAMRA fluorescence was monitored for the efficiency of the strand exchange reaction (Fig. 6a). In conducting in-cuvette FRET experiments with hApo1nF/PNA(C9), hApo1nF/cGapmer (LNA3), and hApo1nF/cGapmer (LNA4), effective fluorescence quenching was observed for hApo1nF/PNA(C9), while largely inefficient quenching was confirmed for both the hApo1nF/cGapmer (LNA3) and hApo1nF/cGapmer (LNA4) systems (Fig. 6b).
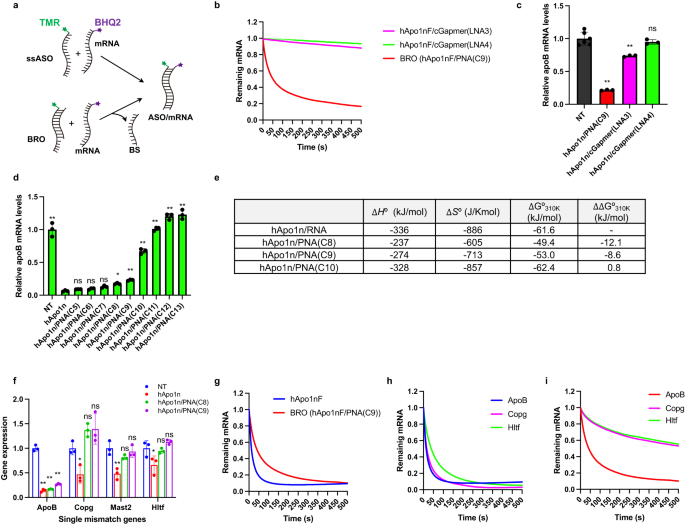
a Schematic illustration of an in-cuvette FRET assay. b Hybridization kinetics were evaluated for the indicated ssASO and BROs using FRET (n = 3 independent experiments). c The antisense effects of hApo1n/PNA(C9) and hApo1n/cGapmer on ApoB mRNA in Huh-7 cells using the CEM transfection method (n = 6 biologically independent samples for control, n = 3 for BRO series; one-way ANOVA followed by two-sided Dunnett’s multiple comparison tests comparing to control, p values from left side; <0.0001, 0.0006, 0.6547). d The antisense effects of hApo1n and hApo1n/PNA(C5-C13) BROs in Huh-7 cells using the CEM transfection method (n = 3 biologically independent samples; one-way ANOVA followed by two-sided Dunnett’s multiple comparison tests comparing to hApo1n, p values from left side; <0.0001, 0.9854, 0.99398, 0.4175, 0.0388, 0.0011, <0.0001, <0.0001, <0.0001, <0.0001). e The van’t Hoff analysis for the indicated ssASO and BROs (n = 3 independent experiments). f Knockdown activities of on-target ApoB gene and three single-mismatch genes were compared for indicated hApo1n and BROs (hApo1n/PNA(C8), hApo1n/PNA(C9)) in Huh-7 cells exposed to 1 µM after 24 h of CEM transfection (n = 3 biologically independent samples; one-way ANOVA followed by two-sided Dunnett’s multiple comparison tests comparing to control, p values from left side; ApoB: <0.0001, <0.0001, <0.0001; Copg: 0.0299, 0.1307, 0.1071; Mast2: 0.0012, 0.1826, 0.8253; Hltf: 0.0262, 0.9132, 0.4780). g Hybridization kinetics for on-target mRNA (ApoB) were evaluated for the indicated ssASO and BROs using FRET (n = 3 independent experiments). h FRET assay of TAMRA-labeled hApo1nF and BHQ2-labeled mRNA mimics (Copg, Hltf). i FRET assay of TAMRA-labeled hApo1nF/PNA(C9) BRO and BHQ2-labeled mRNA mimics (Copg, Hltf). Data in Fig. 6b–d and g–i are presented as mean values ± SD. **p < 0.01, *p < 0.05. “ns” indicates not significant (p > 0.05). Source data are provided as a Source Data file.
These results suggest that the exchange reaction is not merely free energy difference driven, but rather, the kinetic effect of the toehold plays a primary role. Furthermore, when we transfected these BRO duplex pairs into Huh-7 cells by using CEM transfection method, there was an excellent match between the trend of strand exchange rates shown in the FRET assay and the knockdown activity (Fig. 6c). These results provide evidence that the antisense effect of the BROTHERS system is not a simple thermodynamic origin due to a thermodynamic difference (ΔG) between the initial (BRO) and final (ASO/mRNA) duplex states, but that its specially prepared toehold plays a particularly important role in driving the TMSD reaction.
To further investigate BRO’s ability to inhibit hybridization-dependent off-target knockdown, we here selected some mRNAs with single mismatches, which can still serve as good substrates of RNase H24, as representative RNA off-targets. Note also that the evaluation was conducted in vitro as in vivo is more likely to be susceptible to physiological secondary changes. The effects of hApo1n ssASOs and their various BRO counterparts on Huh-7 cells were evaluated using the CEM method (Fig. 6d). The results yielded an ordinal activity sequence that was very similar to the in vivo activity sequence (Fig. 2h). A remarkable decrease in activity was observed between PNA(C9) and PNA(C10) in vitro. A series of van’t Hoff analyses of the Tm revealed that the ΔG310K values of hApo1n/PNA(C8) and /PNA(C9) BROs were slightly lower than those of hApo1n/cRNA(13), while that of hApo1n/PNA(C10) was slightly higher. Such finding indicates the existence of a thermodynamic threshold between PNA(C9) and PNA(C10), which allows the TMSD reaction to occur (Fig. 6e). As shown in Table 2, the Tm values of three mRNAs (Copg, Mast2, and Hltf) containing a single nucleotide mismatch vs. hApo1n were markedly smaller than that of the target ApoB mRNA vs. hApo1n.
To determine the effect of introducing a thermodynamic barrier that disfavors the TMSD reaction on hybridization-dependent off-target knockdown, CEM transfections were performed in Huh-7 cells using hApo1n ssASO and BROs (hApo1n/PNA(C8) and hApo1/PNA(C9)) (Fig. 6f). All agents showed excellent on-target knockdown of ApoB mRNA, with no significant differences between the groups. In contrast, ssASO exhibited significant off-target knockdown of the three single-mismatch-containing genes, while both BROs were found to be free from these off-target effects. To evaluate the susceptibility of BRO to the TMSD reaction for these mismatch genes, the above-described in-cuvette FRET assay system was again utilized.
As shown in Fig. 6g, the FRET assay results revealed that the strand exchange reaction proceeded very efficiently for BRO. Further, binding to ApoB mRNA was observed at a rate comparable to that with ssASO. Figure 6h shows that hApo1nF ssASO efficiently binds to all mismatch genes, except Mast2. Of note, the FRET experiment for the Mast2 mRNA mimic was not operative, which might be due to its intrinsic sequence that possibly forms higher-order structures in the strand (Supplementary Fig. 1). In contrast, Fig. 6i shows that the binding rates of BRO to the mismatch genes were markedly slower than that of ApoB mRNA. These results suggest that optimizing the thermodynamic stability of BRO itself initiated by the binding of the toehold domain, and the thermodynamic stability of ASO to target and mismatch genes enables effective discrimination of on-target from off-target.
Parallel binding mode of PNA suitable for longer ASOs
As described above, antiparallel PNAs tend to reach sufficient binding affinity at a length of approximately 10 bases against ASOs. When the BRO strategy was intended to be applied to ASOs with lengths approaching 20 bases, there were concerns that the single-stranded toehold region would become too long and the design concept of the off-target suppression of the BRO would not be fully realized. In this context, the possibility of using the parallel binding mode of PNA for BS, which tends to have a weaker affinity to complementary strands than antiparallel PNAs36, was investigated with an 18-mer LNA gapmer introduced by Kasuya et al. 53 as a model. Table 3 lists the sequences used in this study.
Acsl1 ssASO is an 18-mer LNA gapmer targeting a shared sequence in both human and mouse acyl-CoA synthetase long-chain family member 1 (Ascl1) mRNA. Considering off-target toxicity, a core focus of this manuscript, longer ASOs generally seem advantageous due to a ostensible reduction in the theoretical number of off-target sequences/sites compared to shorter ones54. Indeed, this 18-nt long ASO has a unique sequence with no full match or single-base mismatch/deletion, besides the target Acsl1 mRNA (Supplementary Table 8). Nevertheless, this ASO has been documented to exhibit hepatotoxicity comparable to the two above-described shorter ASOs. Currently, no comprehensive experimental outcomes unequivocally indicate the superiority of longer ASOs27,55. Thus, offering a BRO option applicable to ASOs of such lengths also holds value.
Parallel PNAs are bound by pairing the 5′ end of ASO with the N-terminus of PNA and the 3′ end of ASO with the C-terminus of PNA. Although the detailed binding mode of DNA/RNA vs. parallel PNA has not been fully revealed, a very well-organized duplex has been depicted via in-house molecular modeling (Fig. 7a), carried out using the density functional tight-binding GFN1-XTB method with the aqueous environment represented by a solvent continuum. Here, parallel PNAs are represented as pPNAs, and five different pPNAs (14−18 nucleotides in length from the C-terminus) were constructed, as shown in Table 3. The optimized structure retains a near-perfect pairing of the bases, with only slight distortions associated with the differences of the PNA backbone from that of the ASO. The melting temperatures of Acsl1n ssASO vs. pPNA and Acsl1 mRNA are summarized in Fig. 7b and Table 3. A comparison of the Tm values suggested that the binding affinity of Acsl1 ssASO to mRNA falls between pPNA(C16) and pPNA(C17). C57BL/6 J mice were treated subcutaneously with 150 nmol/kg ssASO or BROs, killed, and dissected after 96 h.
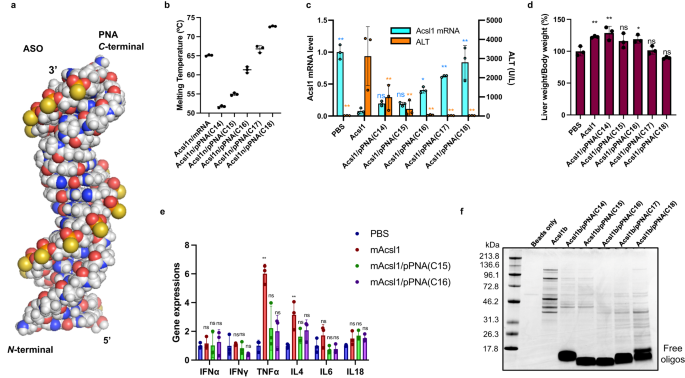
Molecular modeling of Acsl1/parallel PNA a duplex constructed by optimization using the GFN1-XTB method (Supplementary Fig. 18 and Supplementary Data 3). b–e Mouse was subjected to a single subcutaneous injection of indicated ssASO and BROs at a dose of 150 nmol/kg. Melting temperatures of duplexes indicated (n = 3 independent experiments) (b). Acsl1 mRNA expression and ALT levels (n = 3 biologically independent samples; one-way ANOVA followed by two-sided Dunnett’s multiple comparison tests comparing to Acsl1, p values from left side; Acsl1 mRNA: <0.0001, 0.6407, 0.6986, 0.0144, 0.0002, <0.0001; ALT: 0.0002, 0.0059, 0.0007, 0.0002, 0.0002, 0.0002) (c), liver weight (n = 3 biologically independent samples; one-way ANOVA followed by two-sided Dunnett’s multiple comparison tests comparing to control, p values from left side; 0.0096, 0.0014, 0.0760, 0.0308, 0.9996, 0.3554) (d), and liver cytokine mRNA levels (n = 3 biologically independent samples; two-way ANOVA followed by two-sided Dunnett’s multiple comparison tests comparing to control, p values from left side; <0.0001, 0.0572, 0.1375, 0.0004, 0.4732, 0.1077, 0.3809, 0.9160, 0.9453, 0.6497, 0.3958, 0.6092) (e) were evaluated 96 h after administration. f Identification of liver-derived proteins bound by CBB staining for Acsl1b or Acsl1b/pPNA(C14−18) BROs. Data in Fig. 7b–e are presented as mean values ± SD. **p < 0.01, *p < 0.05. “ns” indicates not significant (p > 0.05). Source data are provided as a Source Data file.
Figure 7c shows a graphical representation of Acsl1 mRNA expression in the liver and ALT levels in serum. Acsl1 ssASOs displayed high knockdown activity and high ALT levels. BRO attenuated ALT elevation with increasing pPNA length. However, similar to the above results for antiparallel PNAs, the knockdown activity gradually decreased with increasing pPNA length. Among the BS evaluated in this study, pPNA(C15) and pPNA(C16) were considered the most thermodynamically balanced BRO constructs. The increase in liver weight associated with the hepatotoxicity of Acsl1 ssASO was also attenuated by the application of BRO (Fig. 7c). Kasuya et al. reported that Acsl1 ssASO induces cytokines; therefore, we evaluated whether BRO could alleviate this induction. As shown in Fig. 7e, among the cytokines evaluated, BRO suppressed the significant increase in TNFα and IL-4 caused by Acsl1 ssASO. Finally, to compare the protein-binding properties of these constructs, the same pull-down assay shown in Fig. 5 was performed (Fig. 7f). Based on the results, protein binding was markedly suppressed at all strand lengths by pPNA compared with single-stranded ASO. The bands indicating proteins tended to become dimers with increasing strand length, and the band intensity was the weakest for pPNA(C16), which had the best balance between activity and toxicity.
- SEO Powered Content & PR Distribution. Get Amplified Today.
- PlatoData.Network Vertical Generative Ai. Empower Yourself. Access Here.
- PlatoAiStream. Web3 Intelligence. Knowledge Amplified. Access Here.
- PlatoESG. Carbon, CleanTech, Energy, Environment, Solar, Waste Management. Access Here.
- PlatoHealth. Biotech and Clinical Trials Intelligence. Access Here.
- Source: https://www.nature.com/articles/s41467-023-43714-0