A general shematic presentation of the experimental design and applied methods was illustrated in Fig. 1.
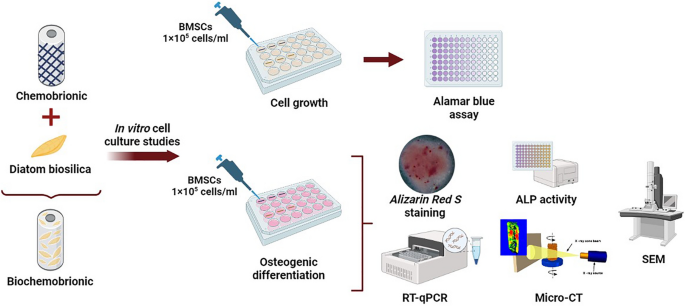
Schematic representation of experimental design.
Materials
Amphora sp. (CCAP 1001/3) was supplied from Culture Collection of Algae & Protozoa (CCAP) of The Institute of Freshwater Ecology, Cumbria, UK. Calcium chloride (CaCl2), magnesium chloride (MgCl2), hydrochloric acid (HCl) (37.0%) were the products of Carlo Erba (Milan, Italy). Sodium silicate (Na2SiO3), potassium phosphate (K2HPO4) were purchased from Sigma Aldrich (USA). For in vitro cell cultures and analyses, alpha modified Dulbecco’s Eagle’s medium (Alpha-MEM) (Capricorn, MEMA-XRXA), Dulbecco’s Modified Eagle Medium–High Glucose (DMEM-HG) (Capricorn, DMEM-HPA), fetal bovine serum (FBS) (Capricorn, FBA-11A), L-glutamine (Capricorn, GLN-B), penisilin-streptomycine (Capricorn, PS-B), ascorbic acid (Sigma, A8960), β-glycerophosphate (Sigma, G9891), dexamethasone (Sigma, D2915), phosphate-buffered saline (PBS) (Sigma, 12,636), trypsin–EDTA (Capricorn, L1805), alamar blue dye (Sigma, B7017-16), ALP activity assay kit (Abcam, ab83369), alizarin red S dye (Applichem, A2306), paraformaldehyde (Sigma, P6148), sodium cacodylate (Sigma, C0250), glutaraldehyde (Merck, S6088703 028), sucrose (Merck), osmium tetroxide (EMS, 1900), TriPure isolation reagent (Roche Diagnostics), mRNA isolation kit (Qiagen, 74,104), cDNA synthesis kit (Thermo Scientific, K1621) were used.
Preparation of BS from diatom
The diatom Amphora sp. was cultured in sterilized F/2 Guillard medium 24 with a salinity of 30‰ and a silica content of 0.2 mM in a 10-L bottle at 24 ± 2 °C. The culture was maintained with constant aeration of 0.5 vvm under a light intensity of 65 µEm−2 s−1 on a 12:12 h light: dark cycle. The cells were harvested by sedimentation and centrifugation on the 12th day of cultivation, washed with distilled water, and the harvested biomass was lyophilized.
To purify the BS, 50 mg of lyophilized biomass was treated with 50 mL of 15.0% (v/v) HCl at 95 °C for 2 h with continuous stirring. After the treatment, the frustule was collected by centrifugation at 2500 × g for 15 min. It was then washed with water 3–4 times to neutralize any residual acid. Then, an oxidation step was performed by adding 50 mL of 30.0% (v/v %) H2O2 to the frustule and stirring at 100 rpm at room temperature for 12 h. It was followed by centrifugation (2500 × g, 10 min) and washing with distilled water. Finally, the frustule was dried at 120 °C for 6 h, and subsequently stored in a desiccator until use 25,26.
Production of CB and BS incorporated BCB scaffolds
CB and BS incorporated BCB scaffolds were produced with the controlled injection method 27. The system consisted of a New Era-100 syringe pump (USA) and a capillary tube to feed solutions, and a polypropylene centrifuge tube containing a hollow agarose template, which was 3.0 cm in height and had an internal space with a 3.0 mm diameter. To prepare the injection solution of BCB scaffold, 0.48 g MgCl2 (0.5 M in the final solution), 0.55 g CaCl2 (0.5 M in the final solution), and 0.2 g (2.0% w/v, which was determined in a preliminary experiment) BS powder were ground together in a mortar. Then, 10 mL of distilled water was added to the grinded mixture and mixed for 30 s with vortex. To disperse the frustule completely, the suspension was sonicated in an ultrasonic bath (Hydra Ultrasonic, Turkey) for 15 min and its pH was set to 2.5 by using 1.0 N HCl. This solution was fed into the alkaline solution (pH = 13.0) containing 3.0 M Na2SiO3 and 0.5 M K2HPO4 by using a syringe pump through a 0.5 mm internal diameter needle with a constant injection rate of 4 mL/h. In order to avoid the sedimentation or collapse of BS, the injection solution was continuously stirred by a magnetic stirrer during the process. For the production of CB scaffold, the injection solution of 0.5 M CaCl2 and 0.5 M MgCl2 was injected into the alkaline solution of 3.0 M Na2SiO3 and 0.5 M K2HPO4 with an injection rate of 2 mL/h. The growth of CB and BCB scaffolds was performed for 2 h, obtained structures were collected from the solution, washed with distilled water, and dried at room temperature in a desiccator.
Characterization of scaffolds
Morphology analysis
The micro morphologies of the CB and BCB scaffolds were observed by SEM (Thermo Scientific Apreo S Instrument, ThermoFisher Scientific, USA). Prior to imaging, samples with standard dimensions (0.3 mm × 10 mm; diameter × height) were gold coated using a sputter coater.
Chemical analysis
To identify the chemical bonds present in the scaffolds, attenuated total reflectance-Fourier transform infrared spectroscopy (ATR-FTIR) was performed. Analysis was conducted with Spectrum Two spectrophotometer (Perkin Elmer, USA) in the range of 500–4000 cm−1 using the KBr technique28.
Thermal analysis
Thermogravimetric analysis (TGA) was carried out to investigate thermal stabilities of the scaffolds. Analysis was performed between 25 to 800 °C at a heating rate of 10 °C min–1 under nitrogen atmosphere.
Mechanical analysis
Mechanical characteristics of the produced scaffolds were analyzed by using uniaxial compressing test with a mechanical testing device (Hybrid Rheometer Discovery HR-2, TA Instruments, USA). At least three different samples (3.5 mm width and 5.0 mm length) were tested at a rate of 6.0 mm/min until failure. Stress–strain curves were plotted from the obtained data and compressive modulus was determined from this slope.
Degradation analysis
The solution-mediated degradations of scaffolds were evaluated using a simulated body fluid (SBF) solution. The samples were completely immersed in 10 mL of SBF solution, which was prepared as described in detail elsewhere 20. Immersed samples were incubated at 37.0 ± 1.0 °C for different time periods up to 28 days, washed with distilled water at the end of the periods, and dried at room temperature. The degradation rate of scaffold was calculated based on the following Eq. (1) by measuring the weight of samples before (W0) and after (Wt) immersion in the SBF at time t.
$$Delta {W}_{t}=frac{{W}_{0}-{W}_{t}}{{W}_{0}}$$
(1)
In vitro cell culture studies
Cell culture
The MSCs derived from the bone marrow of rats were provided from Ege University Bioengineering Department Biomaterials and 3D Biointerphases Laboratory (EBIOPHASE) collection and used with the permission of the Ege University Animal Experiments Local Ethics Committee (EUHADYEK) numbered 2015–020 and dated 25.02.2015. 200–250 g 12 ± 2 months old 2 male adult Wistar-Albino rat bone MSCs were pooled and used for both cell proliferation and differentiation analyses.
MSCs were cultured with α-MEM medium containing 10% (v/v) FBS, 0.1% (v/v) penicillin–streptomycin, and 1.0% (v/v) L-glutamine in a humidified incubator at 37 °C containing 5% CO2. Once cells reached 80% confluency, they were passaged. Prior to in vitro experiments, scaffolds were sterilized with ethylene oxide steam for 24 h at room temperature, followed by aeration for 24 h to eliminate the gas retained. Then, they were placed in 24-well culture plates, and they were conditioned with α-MEM medium containing 10% (v/v) FBS, 1.0% (v/v) L-glutamine, and 0.1% (v/v) penicillin–streptomycin for 2 h. MSCs were seeded at a concentration of 1 × 10⁵ cells/ml onto the surface of scaffolds. The incubation was carried out under standard conditions for 28 days by changing the medium every two days. The average dimensions of the scaffolds used are height (h) 10 mm, radius (r) 1.5 mm, surface area (A) 108 mm2 and volume (V) 70 mm3. The medium used is 500 µL for 24 well.
For osteogenic differentiation, MSCs were first cultured for 48 h in α-MEM medium containing 10% (v/v) FBS, 0.1% (v/v) penicillin–streptomycin, and 1.0% (v/v) L-glutamine. Then, growth medium (GM) was removed from each well, and osteogenic differentiation medium (ODM), composed of DMEM-HG with 10% FBS, 0.1% (v/v) penicillin–streptomycin, 200 μM ascorbic acid, 10 mM beta-glycerophosphate, and 100 nM dexamethasone, was added to the scaffolds. The culture media were changed every 2 days, and the cultivation was carried out for 28 days in a 5% CO2 atmosphere at 37 °C.
Alamar blue assay
The viability of MSCs was assessed using the alamar blue assay at different time points, including 1, 4, 7, 14, and 21 days of culture. At these days, the culture medium was replaced with fresh α-MEM containing 10% alamar blue dye. The cells were then incubated at a temperature of 37 °C for a duration of 4 h. After incubation, 100 µL of medium was transferred to a 96-well plate, and optical density of the media were measured at 570 nm and 600 nm using a microplate reader (Synergy HTX- BioTek Instruments, USA).
Alizarin red S staining
The calcium deposition of the MSCs cultured on scaffolds was evaluated by alizarin red staining after 28 days of incubation. Culture media were removed from culture wells, and scaffolds were washed with Ca+2-Mg+2 free PBS three times. Cells were fixed with 4.0% paraformaldehyde for 30 min and washed with PBS again. Then, scaffolds were stained with a 2.0% alizarin red (pH 4.1–4.3) solution for 2–3 min, and after that, they were washed with PBS many times till the PBS remained colorless. To capture the images of stained scaffolds, an inverted phase-contrast microscope (Olympus, Japan) was used. The calcium deposition on the scaffolds was also examined using the colorimetric analysis of alizarin red staining samples. After monitoring, stained scaffolds were treated with a solution of 20% methanol and 10% acetic acid in water for 15 min under shaking conditions. Then, the liquids with dissolved calcium were transferred to 96-well plates, and their optical densities were measured at 450 nm with a microplate reader 29.
ALP activity
To measure the level of ALP activity, a colorimetric assay kit (Abcam Inc., USA) was used after 21 and 28 days of culture, according to the manufacturer’s instructions. Briefly, an 80 µL cell lysate solution was transferred to a 96-well plate, and 50 µL of the 5 mM p-nitrophenyl phosphate (pNPP) solution was added to each well. They were mixed, and the reaction was carried out at 25 °C under dark conditions for 1 h. At the end of the period, 20 µL of a stop solution was added to each well, and the absorbance of the samples was measured at a wavelength of 405 nm using a microplate reader. The ALP activity (U/ml) of each sample was determined according to the calibration curve of p-nitrophenol standards.
RT-qPCR
The expression levels of osteogenic-specific genes, including ALP, osteocalcin (OCN), osteopontin (OPN), and osteonectin (ON) were determined on day 28 by RT-qPCR. Primer sequences were determined with the web based Primer3 program. The suitability of the primers was confirmed with a web-based in silico PCR program. β-actin was preferred as the internal standard. The primers were commercially synthesized 30,31. Total mRNA of MSCs was extracted using TriPure isolation reagent (Roche Diagnostics) and RNeasy mini kit (Qiagen, CA, USA). Briefly, the medium was removed from culture wells, and scaffolds were washed twice with Ca+2 -Mg+2 free PBS. 1 ml of chilled TRIzol Reagent (Invitrogen, USA) was added to each well, scaffolds were disrupted with pipetting, and they were transferred to the RNase-free tube, followed by the incubation in TRIzol for 5 min at 20 °C. Then, 200 µL of chloroform was added to tubes, the mixture was vortexed, incubated for 15 min at 20 °C, and centrifuged at 4 °C for 15 min at 12,000 g. The upper aqueous phase was transferred to an RNase-free tube and same amount of 70% ethanol was added 32. After carefully mixing, 700 µL of the mixture was transferred to a spin column, and RNA extraction was carried out according to the manufacturer’s instructions. To reverse-transcribe the extracted RNA into cDNA, Revert Aid First Strand cDNA synthesis kit (Thermo Scientific) was used. Real-time PCR was conducted using 2X qPCR SYBR-Green MasterMix reagents (Applied Biosystems, USA). Primers used for bone regeneration, OCN, OPN, ON, and ALP, are presented in Table S1. The relative transcript quantities were determined using the ΔΔCt method, where β-actin was used as the reference gene 33.
Cell morphology and chemical composition
After 28 days of incubation, SEM–EDS analysis was carried out to assess cellular morphological features and chemical composition of the scaffolds’ surface. After washing the scaffolds with PBS (4 °C, pH = 7.0), the cells were fixed for 30 min in 5% (v/v) glutaraldehyde in a 0.1 M sodium cacodylate solution, followed by 7.0% sucrose in a 1.0 M sodium cacodylate solution. A post-fixation step was performed with 2.0% osmium tetroxide in a 0.1 M sodium cacodylate solution at room temperature for 1 h. Scaffolds were washed with distilled water and dehydrated in a graded series of ethanol solutions ranging from 35 to 100% (v/v) and in hexamethyldisilazane. Finally, scaffolds were coated with gold under vacuum conditions and observed by SEM 34. EDS analysis was performed using an equipment coupled with SEM. To ensure the representativeness of the EDS analysis, at least three spectra were acquired from each specimen with random selection.
Micro-CT
For the determination of mineralization in the scaffolds, a micro-CT analysis was performed using the Scanco Medical μCT50 (Switzerland). The scaffolds were scanned before sterilization, and they were incubated under the aforementioned differentiation conditions. After a 28-day incubation period, the samples were washed with PBS and then fixed with a 4% paraformaldehyde solution at room temperature. The scaffolds were carefully positioned in the sample holder of the device and scanned with the following settings: 70 kV, 114 μA source current, 300 ms integration time, 5 μm voxel size, and 360° rotation range. Corresponding 3D images from the obtained 2D slices were reconstructed using micro-CT assistant software.
Data analysis
All the experimental groups were carried out at least in triplicate and the results were presented as mean ± standard deviation (SD). After having verified normal distribution and homogeneity of variance, one-way or two-way analysis of variance (ANOVA) with Tukey or Dunnett’s multiple tests were used to test for statistically significant differences for comparisons. Statistically significant values were defined as ns: p > 0.05, **p < 0.01, ****p < 0.0001.
- SEO Powered Content & PR Distribution. Get Amplified Today.
- PlatoData.Network Vertical Generative Ai. Empower Yourself. Access Here.
- PlatoAiStream. Web3 Intelligence. Knowledge Amplified. Access Here.
- PlatoESG. Carbon, CleanTech, Energy, Environment, Solar, Waste Management. Access Here.
- PlatoHealth. Biotech and Clinical Trials Intelligence. Access Here.
- Source: https://www.nature.com/articles/s41598-024-63171-z