Cell lines
Human pluripotent stem cell (hPSC) lines used in this study include H9 human embryonic stem cell (hESC; WA09, WiCell; NIH registration number: 0062), H1 hESC (WA01, WiCell; NIH registration number: 0043), HES-3 hESC (WiCell), 1196a line (human induced pluripotent stem cell, or hiPSC, from the University of Michigan Pluripotent Stem Cell Core26), and eight hiPSC lines derived from research participants diagnosed with NOA. All protocols for using these hPSC lines have been approved by the Human Pluripotent Stem Cell Research Oversight Committee at the University of Michigan or in the case of the NOA hiPSC lines, the UCLA human pluripotent stem cell research oversight (hpSCRO) committee, and the UCLA Office of Human Research Oversight Protection Institutional Review Board as described below. All hPSC lines have been authenticated by the original sources as well as in-house by immunostaining for pluripotency markers and successful differentiation to the three germ layer lineages. All hPSCs were maintained in a feeder-free culture for at least 10 passages and authenticated as karyotypically normal at the indicated passage number. Karyotype analysis was performed by Cell Line Genetics or in the case of the NOA research participant lines, KaryoStat Assays (Thermo Fisher). All hPSC lines were tested negative for mycoplasma contamination (LookOut Mycoplasma PCR Detection Kit, Sigma-Aldrich).
Derivation of hiPSC lines
Disease-specific hiPSC lines were generated from research participants diagnosed with nonobstructive azoospermia (NOA). This study was approved and reviewed annually by the UCLA Institutional Review Board (IRB #18-001466) together with annual review by the UCLA Human Pluripotent Stem Cell Research and Oversight (hPSCRO) Committee (hPSCRO #2018-005-04). Research subjects consented to a biopsy to generate hiPSCs for differentiation of germ cells. Following the procedure, a 1-mm skin punch biopsy was shipped overnight on cold packs to UCLA in DMEM/F12 (Thermo Fisher Scientific, # 11-320-082). Upon receipt at UCLA, the biopsy was digested with collagenase IV (Life Technologies, # 17018029) for 1 h at 37 °C and 5% CO2. Digested tissues were plated on tissue culture plates coated with 0.1% gelatin (Sigma-Aldrich, # G1890-100G) in a fibroblast culture medium consisting of 15% fetal bovine serum (FBS; GE Healthcare, # 26140079), 1% non-essential amino acids (Invitrogen, # 11140050), 1% glutamax (Gibco, # 35050061), 1% penicillin-streptomycin-glutamine (Gibco, # 10378016) and primocin (Invivogen, # ant-pm-2). Fibroblast outgrowths from tissue pieces were monitored for 3–4 weeks with the medium refreshed every 3 days. When the tissue culture dish became confluent, fibroblasts were passaged using 0.05% trypsin (Gibco, # 25-200-056) and replated to create human dermal fibroblasts (HDFs) which were banked under liquid nitrogen between passage 2-5. For reprogramming, HDFs were thawed and cultivated in the fibroblast culture medium, as described above. Once HDFs became ~80% confluent, they were infected with sendai virus (SeV) using the CytoTune-iPS 2.0 sendai reprogramming kit (Life Technologies, # A16518) according to manufacturer’s instructions. Starting around 3 weeks after infection, individual colonies were picked and expanded either on mitomycin-c treated mouse embryonic fibroblasts (NOA1) in hiPSC medium, DMEF/F-12, 20% knockout serum replacement (Life Technologies, # 10-828-028), 10 ng/mL bFGF (R&D Systems, # 233-FB-010), 1% non-essential amino acids, 1% penicillin-streptomycin-glutamine, primocin, and 0.1 mM β-mercaptoethanol (Sigma-Aldrich, # 21985-023)) or picked directly into Essential 8 medium (E8, Thermo Fisher Scientific, # A1517001) A1517001 and cultured on vitronectin (VTN-N, ThermoFisher Scientific, # A14700) coated tissue culture plates (NOA3,5,6,8-11). VTN-N is a recombinant human protein as truncated basement coating. NOA1 was transitioned to E8 and VTN-N by passage (p) 12. Fibroblasts and resulting hiPSC lines were karyotyped using karyoStatTM (Thermo Fisher Scientific,) and authenticated using Cell ID report (Thermo Fisher Scientific). Self-renewal property of hiPSCs was verified using immunofluorescence for NANOG, OCT4, SSEA4, and TRA-1-91 as previously described27. Additional information on research participants’ fibroblast and hiPSCs (NOA1,3,5,6,8-11) are listed in Supplementary Table 3. All hPSC lines tested negative for mycoplasma contamination (MycoAlert Detection Kit, Lonza, # LT07-318).
Cell culture
hPSCs were maintained in a standard feeder-free culture systems using mTeSR medium (mTeSR; STEMCELL Technologies, # 85850) or TeSR-E8 medium (Essential 8 or E8; STEMCELL Technologies, # 05990). Lactate dehydrogenase-elevating virus (LDEV)-free, hESC-qualified reduced growth factor basement membrane matrix Geltrex (Thermo Fisher Scientific; derived from Engelbreth-Holm-Swarm tumors similarly for Matrigel, # A1413302) was used in Gel-3D culture. For NOA research participant-derived hiPSC lines, VTN-N basement coating were used for coating tissue culture plates. Experiments using the NOA hiPSC lines were conducted between P7-30. For the rest of the cell lines the hPSCs were used before reaching P70.
Generation of Gel-3D culture
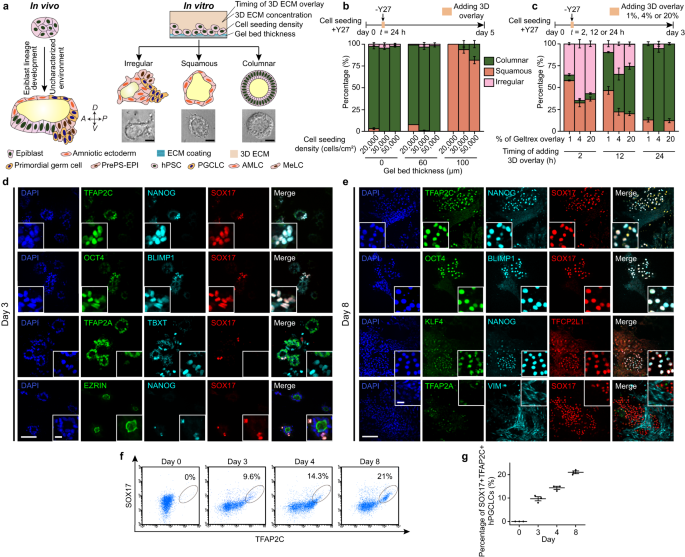
Cultured hPSC colonies were first incubated with Accutase (Sigma-Aldrich, # A6964) at 37 °C for 10 min. hPSCs were then centrifuged, and the resultant cell pellet was resuspended in mTeSR containing 10 μM Y27632 (Tocris, # 1254), a ROCK inhibitor that prevents dissociation-induced apoptosis28. Coverslips were pre-coated with 1% Geltrex at 37 °C for at least 1 h. hPSCs were plated as single cells at 30,000 cells cm−2 onto the indicated substrate.
To establish 3D ECM overlay, 2 h after initial cell seeding, the culture medium was changed to fresh mTeSR or Essential 6 medium (ThermoFisher Scientific, # A1516401) containing 4% (v/v) Geltrex and was replenished daily thereafter. Y27632 was removed from culture medium at 24 h after initial cell seeding (day 1).
Modification of Gel-3D culture for screening
Cultured hPSC colonies were first washed with Dulbecco’s phosphate-buffered Saline (D-PBS; Invitrogen, # 14190144) and incubated with 0.5× TrypLE select enzyme (Gibco, # 50-591-419) and 0.5 mol I-EDTA solution (Nacalai USA, pH 8.0, # 13567-84) at 37 °C, 5% CO2 for 10 min. hPSCs were quenched with E8 medium containing 10 μM Y27632 and gently pipetted to dissociate to single cells. Single cell suspension was centrifuged at 300 g for 5 min before resuspending resultant cell pellets gently in E8 medium containing 10 μM Y27632. Cell counts of all hPSCs were done in parallel using 4-chip disposable hemocytometers (Bulldog Products). For hPGCLC induction screen in 96-well plates, Ibidi USA μ-plate 96 well black, ibiTreat–tissue culture treated polymer coverslip, sterilized plates (Ibidi, Fisher Scientific, # 89626) were used, where each well was pre-coated with 1% Geltrex for at least 1.5 h at 37 °C and 5% CO2. Single-cell suspension of each hPSC line was plated in each well at 35,000 cells cm−2 in technical triplicate. In total, 2.5 h after initial cell seeding, culture medium (E8 medium containing 10 μM Y27632) was changed to fresh E8 medium containing 4% Geltrex and 10 μM Y27632. Culture medium was replenished daily thereafter. Y27632 was removed from culture medium at 24 h after initial cell seeding.
Co-culture assay
H2B-GFP hPSCs suspended in mTeSR containing 10 μM Y27632 were plated as single cells at 10,000 cells cm-2 onto a coverslip precoated with 1% Geltrex at 37 °C for at least 1 h. In total, 24 h after cell seeding, culture medium was switched to mTeSR supplemented with BMP4 (R&D SYSTEMS, # 314-BP-050, 50 ng mL−1), and the cells were cultured for another 48 h. At this point, the culture medium was replaced with fresh mTeSR without BMP4, before small clusters of undifferentiated hPSCs were plated onto the coverslip. Cells were cultured for 2–8 days in mTeSR without BMP4 before downstream analysis.
NODAL-knockout hPSCs
NODAL-knockout (KO) clones were generated from H9 hPSCs by deleting a 58-bp portion of genomic DNA within exon 1 by CRISPR/Cas9. Two cRNA purchased from ThermoFisher Scientific [NODAL_crRNA_1: 5’-AGGCUCAGCAUGUACGCCAG-3’; NODAL_crRNA_2: 5’-AGACAUCAUCCGCAGCCUAC-3’] were used for this purpose. A standard protocol was utilized to prepare duplexes of crRNA:tracrRNA and introduce into H9 cells with the Cas9 enzyme and the pCXLE-EGFP expression plasmid for constitutional expression of EGFP using the NEON electroporation system (Thermo Fisher Scientific). EGFP-expressing single cells were collected into Matrigel-coated 96-well plates by fluorescence-activated cell sorting using FACSAria Fusion (BD Biosciences) with the CloneR single-cell culture supplement diluted with mTeSR Plus medium (STEMCELL Technologies, # 100-1130). To detect the anticipated deletion, genomic DNA was isolated from the single-cell derived clones and subjected to PCR using the following primers designed to amplify NODAL exon 1 [Forward Primer: 5’-CTTCCTTCTGCACGCCTGGTGG-3’; Reverse Primer: 5’-CCAACCCACAGCACTTCCCGAG-3’]. The resulting amplicons were subjected to direct Sanger sequencing using a primer 5’- CTTCCTTCTGCACGCCTGGTGG-3’.
ISL1-knockout hPSCs
HES-3 hPSC line was used to generate ISL1-knockout (KO) cell line by applying CRISPR/Cas9 with the guide RNAs used in the paper13. This cell line was a gift from Dr. Kenneth R. Chien.
Quantification of immunofluorescent images
To quantify the percentage of hPGCLCs in the immunofluorescent images, we used samples from three independent experiments and more than 20 images were captured from different positions of each sample. All immunofluorescent images were taken using the same confocal microscope with the same setups. The images were imported into Fiji software and enhanced using identical parameters. The number of TFAP2C+NANOG+SOX17+ cells was manually counted. DAPI staining was utilized to determine the total cell count. We calculated the percentage of hPGCLCs in each image.
BMP, WNT and TGF-B inhibition assays
In the small-molecule inhibitor treatment assays, either 500 nM BMP inhibitor LDN193189 (LDN; STEMCELL Technologies, # A1516401), or 5 μM Wnt inhibitor IWP2 (Selleckchem, # S7085), or 10 μM of Wnt inhibitor IWR1 (Selleckchem and STEMCELL Technologies, # NC1319406), or 10 μM XAV939 (Cell Guidance System, # SM38-10), or 10 μM TGF-B inhibitor SB 431542 (STEMCELL Technologies, # 72234) was added to the culture medium at indicated time points. Dimethylsulfoxide (DMSO; Sigma-Aldrich, # D2650) was added to the control groups.
Rescue assays
In the assays, either 25–100 ng/ml BMP (R&D SYSTEMS, # 314-BP-050), 50–500 ng/ml WNT3A (Fisher Scientific, # 5036WN010), or the combination of both was added to the culture medium in the Gel-3D culture system and co-culture system for the whole culture time. Dimethylsulfoxide (DMSO; Sigma-Aldrich, # D2650) was added to the control groups.
Immunocytochemistry
hPSCs were fixed in 4% paraformaldehyde (PFA, Thermo Fisher Scientific, # 043368.9 M; buffered in 1× phosphate buffered saline (PBS; Fisher Scientific, # 10-010-072)) at room temperature for 1 h and permeabilized in 0.1% sodium dodecyl sulfate (SDS, Fisher Scientific, #AAJ60015AC) for 30 min. Samples from disease-specific hiPSC lines were blocked in 10% donkey serum (Sigma-Aldrich, # S30-100ML) for 1.5 h at room temperature, followed by incubation with primary antibody solutions in 10% donkey serum at 4 °C for 12–16 h. Samples were then labeled with donkey-raised secondary antibodies in 4% donkey serum at room temperature for 45 min. Other samples were blocked in 2% donkey serum at 4 °C for 24 h, followed by incubation with primary antibody solutions in 2% donkey serum at 4 °C for another 24 h. Samples were then labeled with donkey-raised secondary antibodies (1:400 dilution) in 2% donkey serum at 4 °C for another 24 h. Cell nuclei were stained with 4,6-diamino-2-phenylindole (DAPI; ThermoFisher Scientific, # D1306). All primary antibodies, their sources, and dilutions are listed in Supplementary Table 1.
RT-PCR analysis
To prepare samples for RNA isolation, the samples were first washed with DMEM/F12 to remove Geltrex overlay. A RNeasy Micro Kit (QIAGEN, # 74004) was used following the manufacturer’s instructions to isolate RNA from the cell pellet. A NanoDrop 1000 spectrophotometer (Thermo Fisher Scientific) was utilized to determine RNA quality and quantity. Reverse transcription was performed following the iScript cDNA Synthesis Kit (Bio-Rad). RT-PCR analysis was performed using Quantitect Sybr Green MasterMix (QIAGEN, # 330520) and specific primers on a CFX Connect Real-Time System (Bio-Rad).
To quantify relative gene expression, the 2−ΔCt method was used, and human GAPDH was considered an internal control. All analyses were performed with at least three biological replicates and three technical replicates. The investigator who conducted the RT-PCR analysis was blinded to the test condition allocation during the experiment. Primers are listed in Supplementary Table 2.
scRNA-seq and data analysis
Gel-3D culture at day 3 and day 8 were washed with DMEM/F12 and treated with Accutase for 30 min to obtain single-cell suspensions. Cells from two wells of a 24-well plate were centrifuged at 300 × g for 5 min and transferred into a 1.5 ml tube containing PBS containing 0.5% BSA (Thermo Fisher Scientific, # 11020021). Then the cell suspension is filtered using a 40 um Cell Strainer (Sigma-Aldrich, # BAH136800040) to remove cell clusters. Within 1 h after cell dissociation, cells were loaded into the 10x Genomics Chromium system. 10x Genomics libraries were prepared by the University of Michigan sequencing core according to the manufacturer’s instructions. Libraries were then sequenced with coverage of ~20,000 raw reads per cell on an Illumina NovaSeq with paired-end sequencing. scRNA-seq data were aligned and quantified using Cell Ranger Single-Cell Software Suite (v.3.1.0, 10x Genomics) against GRCh38-3.0.0.
The dimensionality reduction and clustering of scRNA-seq data were performed using R package Seurat (v. 3.1.5)29,30. Default setups were used unless noted otherwise. In brief, cells with nfeature_RNA ≤ 3000 or ≥5200 for day 3, and ≤1800 or ≥4500 for day 8, or cells in which the total mitochondrial gene expression exceeded 8% of total gene expression were discarded from the analysis. A gene expressed in at least 3 cells was retained for analysis. Gene expression was calculated by normalizing the raw count by the total before being multiplied by 10,000 and log transformed. After cell-cycle regression, principal component analysis was performed using the RunPCA function in Seurat. Identification of cell clusters by a shared nearest neighbor (SNN) modularity optimization-based clustering algorithm was achieved using the FindClusters function. Dimensionality reduction was achieved using Uniform Manifold Approximation and Projection (UMAP) algorism (RunUMAP function). Differentially expressed genes (DEGs) were identified using FindAllMarkers, with a minimal fold difference of 0.25 in the logarithmic scale and >25% detection rate in either of the two cell types under comparison. GO analyses were performed using DAVID Bioinformatics Resources 6.8 based on DEGs (Supplementary Data 1).
For comparison with published data, gene expression data obtained from different platforms (GEO repository, NCBI) were first transformed into log2(reads per million mapped reads (RPM) + 1). The average expression level of each cell type was used for the calculation of the correlation coefficient. The ontogenic gene list selected for calculating the correlation coefficient is critical for the accuracy of cell fate identification. Thus, for hPGCLCs and primitive streak lineages were obtained from previous publications7,31, while ontogenic gene list was obtained by merge DEGs of early amnion vs. EPI and late amnion vs. early amnion generated using the dataset reported previously13.
Scatterplot has been generated using log2(RPM + 1) values. Cells and genes were filtered using the same criteria as for all other scRNA-seq analysis. The highly expressed genes were defined as genes whose log2(RPM + 1) values were at least 4-fold greater in one of the cell populations.
Pre-processing single-cell data and gene expression quantification
Published datasets used in this study were downloaded from GSE13457112, E-MTAB-392911, GSE13644710, and E-MTAB93889. scRNA-seq data were processed using the Cell Ranger pipeline (v3.0.0) with default parameters, which uses the STAR aligner (v2.5.1b)32 to map reads to GRCh38 reference genome (v.3.0.0, GRCh38, downloaded from the 10x Genomics website). Published Smart-Seq2 datasets were also mapped on the same reference using the same aligner with default settings to minimize platform and processing differences. Only uniquely mapped reads were kept for gene expression quantification. Raw read counts were further estimated using rsem-calculate-expression from RSEM tool33 with the option of “–single-cell-prior.”
Quality control and normalization
Cut-off based on the number of expressed genes (nGene) and percentage of mitochondrial genes (percent.mito) were used to filter out the low-quality cells. Low-quality cells from Smart-Seq2 datasets were filtered out by having less than 2000 nGene or percent.mito higher than 0.125. scRNA-seq data were filtered by using the same cut-off reported previously (around 3200 <nGene <6400, percent.mito <0.06)12. Cells belong to hemogenic endothelial progenitors and erythroblasts from Carnegie Stage 7 were excluded in the following analysis. After quality control and excluding mitochondria genes, we focused on genes with one or more counts in at least five cells (assessed for each dataset separately) and calculated log-normalized counts using the deconvolution strategy implemented by the computeSumFactors function in R scran package (v.1.14.6)34 and followed by rescaled normalization using the multiBatchNorm function in the R batchelor package (v.1.2.4)35. So, the size factors were comparable across batches. Log-normalized expression after rescaling was further used in integration and marker-gene detection.
Integrated analysis of multiple datasets
We integrated all datasets based on their mutual nearest neighbors (MNNs) using the RunfastMNN function wrapped in R SeuratWrappers package (v.0.3.0) (https://github.com/satijalab/seurat-wrappers). In detail, it was done by performing a principal component analysis (PCA) on the top 2500 highly variable genes selected by RunFastMNN function and then correcting the principal components (PCs) according to their MNNs. We selected the corrected top 25 PCs for downstream UMAP dimensional reduction using the RunUMAP function in the R Seurat package36. As previously discussed37, cells labeled as “ICM” and “PSA-EPI” from Xiang et al. were excluded in UMAP visualization and marker gene detection because those cells were potentially misclassified in the previous annotation.
Marker gene detection and calculating gene-module score
According to the previously published annotation, cells from embryonic datasets were divided into 8 major groups (epiblast, endoderm, trophectoderm, mesoderm, extraembryonic mesoderm, amniotic/embryonic ectoderm, primitive streak (without PGCs), and PGCs). FindMarkers function from R package Seurat performed paired-wise differential expression analysis using ‘roc’ test between groups. The top 15 up-regulated marker genes with at least average power of more than 0.4 conserved in all comparisons were selected to calculate the gene-module score, equal to the mean scaled normalized expression values of top marker genes in each cell. Any scaled values more than 2.5 (less than −2.5) were set to 2.5(−2.5) to avoid the influence of outliers.
Live cell video acquisition
The micropattern array was imaged using the Zeiss Axio Observer Z1 inverted epifluorescence microscope enclosed in the XL S1 incubator (Carl Zeiss MicroImaging) to maintain cell culture at 37 °C and 5% CO2. Fluorescence images were recorded with a 10x objective for 72 h. A GFP filter set was used for the fluorescent imaging of the nuclei of H2B-GFP cells. The fluorescent imaging was performed using an exposure time of 200 ms and a time frame of 15 min to minimize phototoxic effects on cells.
Detection of hPGCLCs after live cell imaging
The sample was fixed, permeabilized, blocked, and stained for NANOG and SOX17 to detect hPGCLCs in the Gel-3D culture.
Live cell video analysis
Live cell video analysis was conducted with a Python pipeline developed by Resto-Irizarry et al.20. In brief, individual cells in a time point were identified after (1) contrast enhancement, (2) thresholding, and (3) cell cluster segmentation. Cells were tracked from one time point to another, using Euclidian distance. Division events were identified with a CNN-LSTM (convolutional neural networks-long short-term memory) machine learning classifier and parent and daughter IDs were stored. The final video frame was compared to the stained samples in order to establish cell identity. For cells identified as hPGCLCs, cell position and division data were used for lineage tracing.
Flow cytometry
Samples from different days were treated with Accutase for 1 h to obtain single-cell suspensions. Single cells were then fixed in 4% PFA for 1 h and then permeabilized in 0.2% Triton X-100 (Sigma-Aldrich, # 11332481001) for 30 min. Samples were then blocked in 2% BSA for 1 h and then incubated with primary antibody for 1 h. Samples were then labeled with donkey-raised secondary antibodies (1:400) for another 1 h. Cells were further analyzed using a Guava EasyCyte (Luminex) flow cytometer and its accompanied software.
Statistical analysis
All experiments were conducted within = 3–5 replicates and repeated in n > 3 independent experiments. Statistical analysis was performed using Origin (https://www.Originlab.com). p values were calculated using unpaired, two-sided Student’s t test. In all cases, a p value of less than 0.05 was considered statistically significant.
Microscopy
All confocal micrographs were acquired using an Olympus DSUIX81 spinning-disc confocal microscope equipped with an EMCCD camera (iXon X3, Andor) and the Zeiss LSM 880 confocal laser-scanning microscope and analyzed via Imaris x64 9.2.1.
Reporting summary
Further information on research design is available in the Nature Portfolio Reporting Summary linked to this article.
- SEO Powered Content & PR Distribution. Get Amplified Today.
- PlatoData.Network Vertical Generative Ai. Empower Yourself. Access Here.
- PlatoAiStream. Web3 Intelligence. Knowledge Amplified. Access Here.
- PlatoESG. Carbon, CleanTech, Energy, Environment, Solar, Waste Management. Access Here.
- PlatoHealth. Biotech and Clinical Trials Intelligence. Access Here.
- Source: https://www.nature.com/articles/s41467-023-43871-2