The animal experiments were performed in accordance with the Guidelines for the Care and Use of Laboratory Animals of the National Institutes of Health. The protocol was approved by the Committee on the Ethics of Animal Experiments of Guangzhou Institutes of Biomedicine and Health, Chinese Academy of Sciences (IACUC: 2023085). The use of human H1 ESCs (WiCell, WA01) in this study is compliant with the Guidance of the Ministry of Science and Technology for the Review and Approval of Human Genetic Resources and was approved by the Life Science and Medical Ethics Committee of the Guangzhou Institutes of Biomedicine and Health under license number GIBH-LMEC2023-024-01 (AL).
Mice
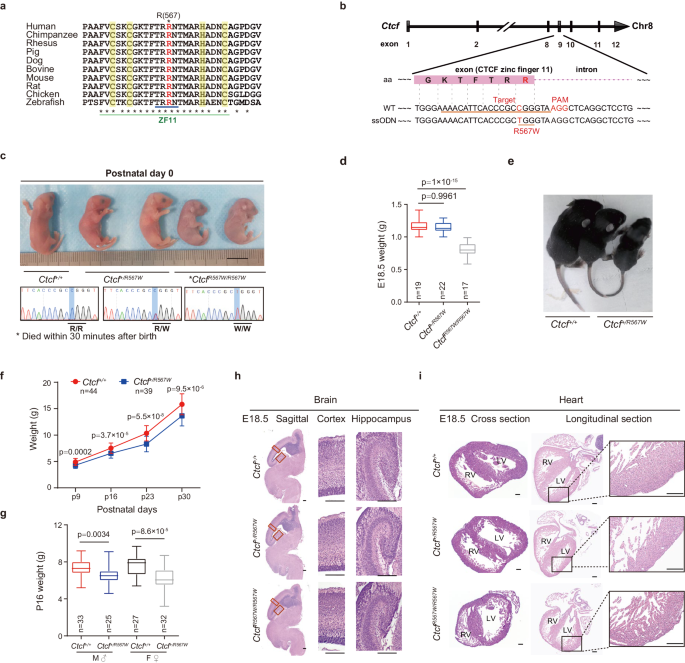
Mice were accommodated in a specific pathogen-free (SPF) facility, maintained under controlled conditions of 20 °C temperature and 50% humidity, with a 12 hour (h) dark/light cycle. Food and water were provided ad libitum. C57BL/6 N mice (Cyagen Biosciences, Guangzhou, China) harboring the CTCFR567W mutation were generated via CRISPR/Cas9-mediated genome editing. The single guide RNA (sgRNA) targeting Ctcf was inserted into the gRNA-spCas9 cloning vector. Single-strand oligodeoxynucleotides (ssODNs) with targeting sequences and mutation sites were synthesized and flanked by 60–80 bp homologous sequences. Ctcf gRNA and Cas9 mRNA were produced by in vitro transcription and coinjected into fertilized eggs with ssODN donors to obtain mutant mice. The mice were identified by PCR and DNA sequencing for genotyping. Mice carrying the Ctcf mutation allele were mated with wild-type C57BL/6 N mice to obtain heterozygous offspring, which were then crossed to generate CtcfR567W/R567W mice. Great efforts have been made to ensure that genetics and environment are comparable among groups in this study. When the number of mice needed for an experiment was small enough to be obtained from a single litter, littermate mice were used for comparisons between genotypes. For experiments requiring larger numbers of mice, pups were selected from two or more litters bred during the same period and housed them under identical conditions. The targeted sgRNA and ssODN sequences for genome editing and the genotyping primers are listed in Supplementary Tables 1 and 2.
Plasmid construction
For construction of the sgRNA-Cas9 vector for gene editing, sgRNA targeting human CTCF was synthesized and constructed into the pX459 vector (pSpCas9(BB)-2A-Puro, Addgene Cat#62988). For construction of the prokaryotic expression vector, the sequence for CTCF ZF fragments was amplified from the cDNA of mESCs and then cloned into the pGEX-4T-2 vector, and the desired mutations were introduced with site-directed mutagenesis to construct the pGEX-ZF-wt, pGEX-ZF-mut (R567W) and pGEX-ZF-dmut (R566C, R567W) vectors.
Tissue processing and cell culture
Pregnant mice were anesthetized with 1.2% v/v avertin (2,2,2-tribromoethanol) (Sigma, Cat# T48402) and sacrificed by cervical dislocation. The embryos were removed, and the desired fetal mouse tissues were taken immediately after decapitation. For brain tissue retrieval and neural cell culture, the whole brain of the fetal mouse was removed by dissection, the meninges were stripped, and the cerebral cortex and hippocampus were separated. Tissues were digested by using the papain dissociation system (Worthington, Cat# LK003160) according to the manufacturer’s instructions. Cells were filtered through a 70 μm filter membrane, counted and inoculated in culture dishes coated with poly-D-lysine (PDL) (Sigma, Cat# P6407). Primary neurons were first cultured in medium containing DMEM/F12 (Gibco, Cat# 11130032) supplemented with 10% v/v fetal bovine serum (FBS) (Vistech, SE100-B) and 1% v/v penicillin/streptomycin (Gibco, Cat# 15140122) at 37 °C in a 5% CO2 incubator. The medium was replaced after 3–4 h with neurobasal medium (Gibco, Cat# 21103049) supplemented with 2% v/v B27 (Gibco, Cat# 17504044), 1% v/v GlutaMAX (Gibco, Cat# 35050061) and 1% v/v penicillin/streptomycin. The medium was changed every other day. HEK293T cells were cultured in high-glucose DMEM (HyClone, Cat# SH30022.01) supplemented with 10% v/v FBS. Feeder-free H1 hESCs (WA01) (WiCell) were cultured in PGM1 human pluripotent stem cell culture medium (Cellapy, Cat# CA1007500) in Matrigel (Corning, Cat# 354277)-coated culture plates. Then, the cells were digested into clumps with 0.5 mM EDTA for normal culture or digested into single cells with Accutase for passaging (STEMCELL Technologies, Cat# 07920) and cultured with medium containing 10 μM ROCK inhibitor Y-27632 (Sigma, Cat# SCM075) for one day; then the inhibitor was withdrawn, and cells were cultured in normal medium to form individual clones.
Generation of CTCFR567W point mutation-containing hESC lines
Human H1 cells harboring the CTCFR567W mutation were constructed via CRISPR/Cas9. sgRNAs were designed with an online tool (http://benchling.com). The ssODN containing the desired mutation and enzymatic cleavage site was used as a template for homologous repair. The sgRNA primers were synthesized, annealed, cloned and inserted into the pX459 vector. The Cas9-sgRNA vector and ssODN were transfected into cells for gene editing using FuGENE HD (Promega, Cat# E2311) transfection reagent. Since Cas9-sgRNA vector contained puromycin resistant gene, the cells were screened with medium containing 1 μg/mL puromycin (Gibco, Cat# A11138-03). After 48 h of screening, the surviving cells were digested into single cells using Accutase for passaging into Matrigel-coated 6-well plates. After ~10 days of culture, the single cells were successfully expanded into individual clones. Over one hundred clones were observed under a microscope and manually picked out using a micropipette. The selected clones were transferred to 96-well plates and further cultured for ~3–5 days until they reached a sufficient size. Subsequently, the clones were digested using 0.5 mM EDTA in PBS to detach them from the culture plates for passaging and amplification. Once the clones reached a certain quantity, a portion of the cells was collected for subsequent genomic DNA extraction and PCR genotyping, followed by enzyme digestion and Sanger sequencing for identification of correctly edited clones.
Detailed information on clones and editing strategies: The first round of editing in wild-type cells using sgRNA1 (target: AACATTTACACGTCGGGTAA) and ssODN1 (introducing the EcoR I site) yielded several heterozygous clones, which were verified by genotyping to have one allele that was correctly mutated and the other allele with a 6 bp deletion. These clones were referred to as heterozygous clone 1. Several wild-type clones were also retained after transfection and were selected as editing control wild-type clones. In the second round of editing, sgRNA2 (target: TGGGAAAACATTTACACGTC) and ssODN2 (introducing the Mlu I site) or ssODN3 (introducing the EcoR I site) were used to edit heterozygous clone 1 and wild-type cells, respectively. This process yielded homozygous clones 1 and 2, and heterozygous clone 2. The clones were verified by genomic PCR, enzyme digestion, and Sanger sequencing. cDNA PCR (with primers for exons 8–10 [aa 469–644]) and sequencing also confirmed that the clones were correct (Supplementary Fig. 9a–d). The sequences of the targeted sgRNAs, ssODNs and genotyping primers used are listed in Supplementary Tables 1 and 2.
RNA extraction and RT-qPCR
Total RNA was extracted from cells and tissues with an RaPure Total RNA Micro Kit (Magen, Cat# R4012-03) according to the manufacturer’s instructions. For cells, 1 × 10⁵ – 1 × 10⁶ cells were counted and collected. For tissues, the isolated mouse tissues were immediately crushed with a homogenizer. RNA quantification and reverse transcription were performed with HiScript III RT SuperMix for qPCR (+ gDNA wiper) (Vazyme Biotech, Cat# R323-01). Real-time PCR was performed with SYBR Green mix (Genstar, Cat# A301-01) on a CFX96 real-time PCR system (Bio-Rad) according to the manufacturer’s instructions. Gapdh mRNA was used as an internal control for normalization of gene expression. The primers used in this study are listed in Supplementary Table 3.
Protein extraction and immunoblotting
Isolated mouse tissues or cultured cells were lysed with RIPA buffer (1% v/v Triton X-100, 0.1% w/v sodium dodecyl sulfate (SDS), 150 mM KCl, 50 mM Tris-HCl (pH 7.4), 1 mM EDTA, 1% w/v deoxycholic acid (sodium salt)) supplemented with protease inhibitors (PIC) (Bimake, Cat# B14001) followed by sonication. The total protein supernatant was obtained by high-speed centrifugation, and the samples were separated on SDS-PAGE gels and transferred to polyvinylidene fluoride (PVDF) membranes (Millipore, Cat# IPVH00010). The membranes were blocked with 5% w/v skim milk and incubated with primary and secondary antibodies before being washed with TBS-T buffer (20 mM Tris-HCl (pH 7.5), 150 mM NaCl, 0.1% v/v Tween-20). Finally, the membranes were assessed with an enhanced chemiluminescence (ECL) Kit (NCM Biotech, Cat# P10300). The antibodies used in this study are listed in Supplementary Table 6.
Histology, immunofluorescence, and image acquisition
Intact mouse tissues were fixed with 4% w/v paraformaldehyde (Beyotime Biotechnology, Cat# P0099) for 24 h and then made into 3 μm paraffin sections per standard protocols. Hematoxylin and eosin (H&E) staining was performed according to the manufacturer’s instructions (Servicebio, Cat# G1005). For immunohistochemistry, sections were treated with 0.3% v/v H2O2 for 15 min, washed with PBS, blocked with 1% w/v BSA containing 0.3% v/v Triton X-100 for 1 h, and incubated with antibodies at 4 °C. After washing 5 times with PBS, the sections were incubated with secondary antibodies and then stained with DAB and hematoxylin. Images were acquired with a Pannoramic MIDI slice scanner (3D HISTECH).
For immunofluorescence, samples were rinsed with PBS for 3 min, and fixed in 4% w/v paraformaldehyde for 10 min. Following PBS rinses and permeabilization in 0.5% v/v Triton X-100 for 15 min, samples were blocked in 1% w/v BSA/PBS for 1 h. Next, primary antibodies diluted in 1% w/v BSA/PBS were added and incubated for 2 h at room temperature (RT). Following the removal of the primary antibody and subsequently wash with PBS, secondary antibodies were added at a 1:500 dilution in 1% BSA/PBS and incubated for 1 h at RT. After washing with PBS three times for 5 min each time, the samples were stained with DAPI/PBS (1:1000) for 10 min and washed with PBS. The antibodies used in this study are listed in Supplementary Table 6.
For image acquisition, the samples were analyzed by using a Pannoramic MIDI slice scanner (3D HISTECH, CaseViewer 2.4.0, 20x objective), a light microscope (OLYMPUS IX73, cellSens software, 40x objective) or a LSM 710 NLO confocal laser scanning microscope (Carl Zeiss Technology, ZEN 2012 software, 40x objective). Sholl analysis54 was performed on individual neurons by using ImageJ software to quantify their morphological characteristics.
Golgi staining
E18.5 mice were delivered by cesarean section as described above. Golgi staining experiments were conducted using an FD Rapid GolgiStain™ Kit (FD Neuro Technologies, Cat# PK401-50) according to the kit instructions. Briefly, the brains of E18.5 mice were removed as quickly as possible, soaked in an equal-volume mixture of solutions A and B while protected from light at RT for 2 weeks and then transferred to solution C for another 3 days. The impregnated brains were sliced using a vibratome (Leica VT1200S) at a thickness of 100 μm. The sections were immersed in a mixture of solutions D and E for 10 min, dehydrated, cleaned with xylene and then sealed with resin sealing tablets. Images of brain regions of interest were taken by bright-field microscopy.
Intracellular Ca2+ imaging
Neurons from the cortex or hippocampus were loaded with Fluo-4-AM (4 μM) (Yeasen, Cat# 40704ES72) in culture medium at 37 °C for 30 min. Afterward, the neurons were washed with PBS three times, and culture medium was added for the following measurements. The relative fluorescence intensity was measured with a fluorescence microscopic system equipped with a FITC filter. During the measurements, KCl was added to a final concentration of 30 mM to depolarize the neurons and evoke Ca2+ influx. The recorded images were quantified with ImageJ software.
Multielectrode array (MEA) measurements
MEA experiments were recorded using the Maestro Pro system (Axion Biosystems). Briefly, brain tissues were isolated and digested as described above. Approximately 1 × 10⁵ primary neurons were inoculated into PDL-coated 48-well MEA plates (Axion Biosystems, Cat# M768-tMEA-48W), and primary neural cells were cultured as described above. The spontaneous neural electrical activity of the cultured cells was recorded weekly, and the medium was changed 24 h prior to recording. The plates were loaded into the Maestro Pro instrument, and electrical activity was recorded by AxIS Navigator software for 15 min, measuring the number of active electrodes (electrodes with an average of 5 spikes per min), the number of spikes, the number of bursts (individual electrodes with > 5 spikes in 100 ms), the number of network bursts (35% of electrodes with > 50 spikes in 100 ms simultaneously), the synchronization index (with a synchrony window of 20 ms) and other metrics. The data were exported using the Neural Metric Tool and analyzed with GraphPad Prism 9 software.
Mouse behavioral tests
Mice were group-housed (5–8 animals per cage) in standard filter-top cages with ready access to water and rodent food and maintained on a 12 h light/dark cycle with 50–60% relative humidity. Mouse behavioral experiments were performed using 8–12 week-old male mice as described previously55,56,57. During data collection, investigators were blinded to the group allocation of the mice to ensure the unbiased results. Each apparatus was cleaned with 75% v/v alcohol spray prior to testing each animal to prevent bias due to olfactory cues.
Open-field test (OFT)
Each mouse was placed in an open-field arena (44.5 cm × 44.5 cm × 44.5 cm) and allowed to explore freely for 15 min. The activity of the mice in the box was automatically recorded with a camera and the animal behavior analysis software EthoVision XT 13 (Noldus), and each mouse was tested only once.
Novel Object Recognition test (NOR)
NOR experiments were performed in the same open-field arena (44.5 cm × 44.5 cm × 44.5 cm) as the OFT. During the habituation phase, mice were allowed to freely explore the arena and two identical objects for 5 min. The mice were then placed back in the home cage for 1 h as a time interval sufficient for detection of memory in the next phase. During the testing phase, one of the objects was replaced with a new object, and mice were allowed to explore freely for 5 min. The exploration time and times as well as the distance from each object (touching the object with the mouth or nose and approaching the object within ~2–3 cm were considered as exploration of the object) were automatically recorded with a camera and the animal behavior analysis software EthoVision XT 13 (Noldus).
Three-chamber test for social interaction and novelty behavior
The test apparatus consisted of a rectangular three-chambered box. Each chamber measured 20 × 40 × 22 cm and was evenly separated by walls with two retractable doors (each door 3 × 5 cm), allowing mice access to each chamber. An unfamiliar male mouse (stranger 1), which had no prior contact with the subject mice, was placed in one of the side chambers. This unfamiliar mouse was enclosed in a small, round wire cage that enabled nose contact between the bars but prevented fighting. The wire cage was 11 cm high and 9 cm in diameter at the bottom, with vertical bars spaced 0.5 cm apart. Subject mice were first placed in the middle of the chamber and allowed to freely explore throughout the test box for 10 min. The time spent around the cage was measured with the aid of a camera mounted on top of the box to quantify of social preference for stranger 1. A second unfamiliar male mouse (stranger 2) was placed in an identical small wire cage on the other side of the chamber. Thus, the test mice could choose between the first unfamiliar mouse that had already been studied (stranger 1) and a new unfamiliar mouse (stranger 2). As before, the test mice were free to move around in the three chambers for 10 min. The animal behavior analysis software EthoVision XT 13 (Noldus) automatically recorded the time and number of mutual contacts between the test mice and Stranger 1 and Stranger 2.
Elevated plus maze test (EPM)
The EPM apparatus consisted of two open arms and two closed arms (each 9.5 cm wide and 40 cm long) arranged in a cruciform pattern, with the intersection being the central zone, which was 55 cm above the floor. To assess anxiety, mice were placed in the central area, facing an open arm and allowed to explore freely for 5 min. The time and number of explorations in the open and closed arms were automatically recorded by EthoVision XT 13 (Noldus).
Tail suspension test
A cylindrical tube was placed over the tail of the mouse to prevent the mouse from holding its leg during suspension. One end of the tape was stuck to the tail of the mouse, and the other end was fixed to the hanging tail support. The distance from the head of each mouse to the platform was ensured to be the same. The suspension lasted for 6 min, and the immobility time during the last 4 min was recorded with a video camera and analyzed.
Forced swim test
Mice were placed in a 25 cm high, 10 cm diameter clear glass cylinder filled with water to a depth of 10 cm at 22 °C. A 6 min swimming test was performed on each mouse, and the last 4 min of immobility time was recorded for further processing.
Morris water maze
Mice were placed in a circular tank (137 cm in diameter) filled with water (22 ± 1 °C) and divided into quadrants with visual cues for spatial orientation. The circular platform (10 cm in diameter) was adjusted to be submerged 1 cm below the water surface, and the position of the platform was unchanged. Each mouse entered the water from one of the four quadrants at a time. Each mouse was gently placed into the water facing the wall of the tank and each trial lasted 1 min; the trial ended when the mouse climbed onto and stayed on the hidden platform for 10 s. The software automatically recorded the time taken by the mouse to reach the platform as the latency; if the mouse failed to find the hidden platform within 1 min, the mouse was guided to the platform and allowed to stay on the platform for 15 s. The mouse was removed and dried with a dry towel. Four trials were performed per mouse per day at intervals of 30 min or more for 6 consecutive days of training. On day 7, the platform was removed, and each mouse was placed in the water in the quadrant opposite the target quadrant. The software was used to record the number of times each mouse crossed the platform as well as the time and distance it moved in the target quadrant within 1 min. The probe trial was performed twice.
Rotarod test
The rotarod test involved 3 training sessions per day for 4 days. The first day began with acclimatization of all experimental mice at a lower speed (4 r/min) to eliminate fear, with each mouse trained 3 times for 5 min each at intervals of 30 min or more. The next 3 days, the rotarod was set to accelerate from 4–25 rpm for 300 s and the time spent by each mouse on the rotarod was recorded.
Protein purification
BL21(DE3) chemically competent cells (TransGen Biotech, Cat# CD601) were transformed with pGEX-4T-2, pGEX-ZF-wt, pGEX-ZF-mut (R567W) and pGEX-ZF-dmut (R566C, R567W) plasmids and grown to an OD600 of 0.6–0.8 at 37 °C in LB medium containing 100 μg/mL ampicillin. The cells were induced by adding 1 mM IPTG and 200 μM ZnSO4 at 28 °C for 6–8 h. The cells were collected by centrifugation at 4 °C and resuspended in appropriate lysis buffer (PBS with 1 mM DTT, 0.5 mM EDTA) supplemented with 1 × PIC before being sonicated. The cell debris was removed by centrifugation at 20,000 × g. The supernatant was filtered through a 0.45 μm membrane and combined with prewashed glutathione agarose resin (Yeasen Biotech, Cat# 20507ES10) via incubation at 4 °C for 2–4 h. The GST fusion proteins were then washed with PBS-T buffer (PBS with 1% v/v Triton X-100 and 1 × PIC) and eluted with glutathione elution buffer (50 mM Tris-HCl (pH 8.0), 10 mM reduced glutathione, 2 mM DTT, 150 mM NaCl and 1% v/v Triton X-100). The eluted proteins were quantified by the Bradford method and concentrated for subsequent use.
Electrophoretic mobility shift assay (EMSA)
EMSA experiments were performed using a chemiluminescent EMSA Kit (Beyotime Biotechnology, Cat# GS009) according to the manufacturer’s instructions. Briefly, probes for the CTCF motif were synthesized and annealed. The probes were incubated with appropriate amounts of purified GST fusion proteins for 10–20 min at RT and then electrophoresed on a 5% v/v native polyacrylamide gel in ice-cold 0.5 × TBE buffer (45 mM Tris-borate, 1 mM EDTA (pH 8.0)). The gels were scanned in a gel imaging system (Azure Biosystems). The bound/free ratios of probes were quantified with ImageJ software. The sequences of EMSA probes of CTCF motifs are listed in Supplementary Table 4.
GST pull-down assay
GST pull-down experiments were performed by incubating appropriate amounts of biotin-modified probes, purified GST fusion protein and glutathione agarose resin for 6–12 h. Then, glutathione agarose was washed with PBS-T buffer (PBS with 1% v/v Triton X-100) supplemented with 1 × PIC. After centrifugation, the precipitated complexes were digested with proteinase K (Tiangen Biotech, Cat# RT403). The enriched probes were extracted with phenol:chloroform:isoamyl alcohol (25:24:1, Sigma-Aldrich, Cat# P3803) followed by ethanol precipitation and purification. The enriched DNA was spotted onto an Amersham Hybond-N+ membrane (GE Healthcare, Cat# RPN203B), UV cross-linked for 10 min and incubated with streptavidin-HRP (Beyotime Biotechnology, Cat# A0303). Finally, the membranes were washed and detected with an ECL chemiluminescence kit. The sequences of GST pull-down probes of CTCF motifs are listed in Supplementary Table 4.
RNA-seq and data analysis
The RNA-seq experiments followed as previously described58. Total RNA was extracted from cells and tissues with an RaPure Total RNA Micro Kit according to the manufacturer’s instructions. The libraries were constructed using the VAHTS Universal V8 RNA-seq Library Prep Kit for Illumina (Vazyme Biotech, Cat# NR605) according to the manufacturer’s instructions. Briefly, total RNA was purified by two rounds of mRNA purification steps with mRNA capture beads to ensure removal of rRNA. The mRNAs were fragmented to 250–450 bp at 85 °C for 6 min. Immediately afterward, cDNA first- and second-strand synthesis, end-repair and adapter ligation reactions were performed. cDNA purification and size selection were performed with AMPure XP magnetic beads (Beckman Coulter, Cat# A63882). The product was used for library amplification and purification followed by sequencing on an Illumina NovaSeq platform (Annoroad Gene Technology Co., Ltd.). For RNA-seq data analysis, paired-end reads were handled with Trim Galore (version 0.6.5) and then mapped to the mouse (mm10) or human (hg38) genome using STAR aligner (version 2.7.0)59. Transcript abundance was quantified by RSEM (version 1.2.22)60. To remove the effect of sex on gene expression in mouse samples, genes originating from ChrX and ChrY were filtered out. DEGs were determined using DESeq2 (version 1.32.0)61 with q-value < 0.05 and fold-change > 1.5. Gene Ontology (GO) analysis was performed using clusterProfiler (version 4.0.0)62. The DEGs of mouse brain tissues and neurons are listed in Supplementary Data 1. The DEGs of human cortical organoids are listed in Supplementary Data 2.
SnRNA-seq and data analysis for mouse brain cortex
Nuclei of E18.5 mouse brain cortex tissues were extracted using lysis buffer (10 mM Tris-HCl (pH 7.4), 10 mM NaCl, 3 mM MgCl2, 0.1% v/v NP 40, 0.01% w/v digitonin, 1% w/v BSA, 0.1% v/v Tween-20, 1 mM DTT, 1 U/μL RNase inhibitor). The suspended nuclei were filtered using a cell strainer and counted using Countess II FL Automated Cell Counter (Thermo Fisher Scientific) for subsequent single-cell capture. SnRNA-seq library was performed by SequMed Biotech Inc. (GuangZhou, China) following the manufacturer’s instructions using BD Rhapsody WTA Amplification kit (BD Biosciences, Cat #633801). Briefly, the cells and barcoded magnetic beads were added to the microwell plate chip of the BD Rhapsody system. Each bead was linked with a cell in a microwell. The next steps involved cell lysis within the microwells, release of mRNA with polyA tails, and its capture by the oligo-dT of the magnetic beads. The captured single-cell mRNA transcriptome was then collected, and reverse transcription was performed to obtain cDNA sequences. The cDNA underwent second-generation sequencing library construction and was subjected to quality control before being sequenced on the Illumina NovaSeq platform in PE 150 mode.
For snRNA-seq data analysis, the BD Rhapsody whole transcriptome analysis (WTA) pipeline was utilized to process FASTQ files, converting raw sequencing reads into gene expression matrix with unique molecular identifier (UMI) counts for each gene in each cell. The Seurat (version 4.0.5) was utilized for further analysis of the read count matrix for each gene/sample. Quality control measures were applied to filter individual cells, retaining only those expressing genes detected in at least 3 cells and cells expressing a minimum of 200 genes. Additionally, cells with gene expression counts ranging from 500–6000, mitochondrial gene expression not exceeding 20%, and a minimum RNA count of 2000 per cell were retained. The analysis yielded 13137 single cells in wild-type sample and 15661 in mutant sample that were used for subsequent clustering and differential expression analyses.
For cell annotation, the ScType package37, which employs machine learning algorithms and reference datasets, was used. This package annotated the cell types based on the gene expression profiles of the single cells, leveraging marker genes or gene expression patterns to assign cell types. To identify genes showing differential expression between CTCF mutated sample and wild type sample, the Seurat package’s FindMarkers function was employed. Differential expression analysis utilized the Wilcox method, which applies the Wilcoxon rank-sum test to compare gene expression levels between groups of cells. Benjamini-Hochberg method was used for multiple testing correction of p-values to ensure the rigor of the statistical results. A corrected p-value < 0.05 with log2 fold change above 0.5 was considered statistically significant. All significant DEGs in each cell type were selected for GO enrichment analysis using clusterProfiler (v3.18.1). The DEGs are listed in Supplementary Data 3.
SnRNA-seq and data analysis for mouse heart and lung tissues
SnRNA-seq of E18.5 heart and lung tissues were performed by Jiayin Biotechnology Ltd. (Shanghai, China) according to the instruction manual of the Chromium Single Cell 3’ Reagent Kit v3 (10x Genomics, Cat# PN-1000075) with the 10x Genomics platform.
For snRNA-seq data analysis, paired-end reads were aligned to the mouse reference genome (mm10) using Cell Ranger (version 6.1.1). Raw count matrices were used to remove ambient RNA with SoupX (version 1.6.1)63 and then analyzed using Seurat (version 4.1.1)64. Poor-quality cells (> 50% mitochondrial genes, < 500 genes and < 500 UMI per cell for heart samples; > 5% mitochondrial genes, < 500 genes and < 1000 UMI per cell for lung samples) were filtered out. Potential doublets were removed with DoubletFinder (version 2.0.3)65. The data were then normalized and integrated using the SCTransform integration workflow by regressing out the cell cycle effect and percentages of mitochondria-expressed genes per cell. PCA was performed (npcs = 50), and dimensionality reduction (uniform manifold approximation and projection, UMAP) and clustering were then carried out (dimensions = 30; cluster resolution = 0.2 for heart samples, 0.4 for lung samples). Cell markers for each cell cluster were determined with the FindAllMarkers function. For heart samples, cell types were annotated based on a reference paper66. For lung samples, cell types were manually verified based on canonical markers. DEGs were identified via FindMarkers with a min. pct = 0.25 and an adjusted p-value < 0.05, and are listed in Supplementary Data 4 and 5. GO networks for DEGs were constructed using BinGo (version 3.0.5)67 and then visualized in Cytoscape (version 3.9.1)68.
ChIP-seq
ChIP experiments were performed as described previously with some modifications69,70. Briefly, an appropriate amount of mouse tissue was crushed with a homogenizer, cross-linked with 1% w/v formaldehyde for 10 min and quenched with 0.125 M glycine. The crosslinked tissues were lysed in ChIP lysis buffer (1% w/v SDS, 10 mM EDTA, 50 mM Tris-HCl (pH 8.0) and 1 × PIC) and then sonicated to obtain chromatin fragments 200–400 bp in size. For normalization, an equal amount of HEK293T chromatin was added to the sample chromatin solution of different groups for subsequent ChIP experiments. Immunoprecipitation was carried out using 5 μg of antibodies for a duration of 12 h incubation at 4 °C, followed by a 2 h incubation with Dynabeads™ protein G (Thermo Fisher Scientific, Cat# 10003D). The immune complexes were subsequently washed with low salt buffer, high salt buffer, LiCl wash buffer and TE buffer. The enriched chromatin DNA was reverse-crosslinked and then purified using the MinElute PCR Purification Kit (Qiagen Cat# 28006) for ChIP-qPCR or ChIP-seq library construction. ChIP-seq libraries were constructed using the VAHTS Universal DNA Library Prep Kit for Illumina® V3 (Vazyme Biotech, Cat# ND607) according to the manufacturer’s instructions. Briefly, 1–5 ng of enriched DNA was end-repaired and adapter-ligated. PCR library amplification was performed using VAHTS Multiplex Oligos Set 4 for Illumina (Vazyme Biotech, Cat# N321). DNA size selection and library purification were performed with AMPure XP Beads followed by sequencing on the Illumina NovaSeq platform (Annoroad Gene Technology Co., Ltd.). The primers of ChIP-qPCR used in this study are listed in Supplementary Table 5.
ChIP-seq data analysis
Raw reads were trimmed to remove adapters using Trim Galore and then mapped to the mouse (mm10) and human (hg38) mixed genomes using Bowtie2 (version 2.2.5)71 with the following parameters: –very-sensitive –end-to-end –no-unal –no-mixed –no-discordant. Only uniquely mapped reads with MAPQ > 30 were retained. Reads mapped to the mouse or human genome were separated and then subjected to peak calling using macs2 (version 2.2.7.1)72 with the default options. The CTCF peaks are listed in Supplementary Data 6.
To quantitatively compare the CTCF binding strength between wild-type and CTCF-mutated samples, CTCF ChIP signals were normalized according to the method in a previously published paper with minor changes73. Normalization was performed based on the assumption that the average CTCF binding strength from HEK293T cells mixed in different samples should be the same. The peak summit value of the averaged CTCF binding strength from HEK293T cells for each sample was extracted to calculate the scale factor. The scale factor for wild-type samples was considered to be 1. For corresponding CTCF-mutated samples, the scale factor was calculated by summit (wild-type)/summit (mutant). The scale factors for brain, heart and lung samples are shown in Supplementary Fig. 7a. Normalized bigwig files were generated with the bamCoverage tool in deepTools2 (version 3.5.1)74 using RPGC normalization and scale factors.
CTCF upstream motif analysis
The CTCF core motif was first identified for each CTCF site with FIMO (version 5.5.3)75 using the parameter “–thresh 1e-4” with the CTCF position frequency matrix obtained from the HOCOMOCO database, and then the upstream 20 bp sequence for each CTCF site was extracted. The upstream sequences were clustered using hamming distance. Heatmaps were generated with ggmsa (version 1.3.4)76, and sequence logos were generated with ggseqlogo (version 0.1)77.
The CTCF motif in the promoters of Pcdh genes was analyzed as follows. As the CTCF binding strength in most Pcdh promoters was weak (Supplementary Fig. 8h), CTCF binding sites were hardly identified using the default parameters of macs2. Instead, CTCF binding regions in Pcdh promoters were manually selected based on the CTCF ChIP signal. Then, the CTCF core motif sequences and ± 20 bp flanking sequences were extracted, and sequence logos were generated with ggseqlogo.
Bridge Linker-Hi-C (BL-Hi-C)
The BL-Hi-C experiments were conducted following previously established procedures78. In summary, suitable quantities of mouse tissues were crushed using a homogenizer, cross-linked with 1% w/v formaldehyde for 10 min, and subsequently neutralized with 0.2 M glycine. The nuclei were extracted with SDS lysis buffer (1% w/v SDS, 50 mM HEPES-KOH (pH 7.5), 150 mM NaCl, 1 mM EDTA, 1% v/v Triton X-100, 0.1% w/v Sodium Deoxycholate) and then utilized for subsequent procedures: digestion with HaeIII (NEB, Cat# R0108L) at 37 °C for 12 h, end-plus-A treatment with 10 mM dATP (NEB, Cat# N0440S) and Klenow Fragment (exo -) (NEB, Cat# M0212L) at 37 °C for 30 min, along with proximity ligation with biotin-labeled BL-Linker (oligo sequences were listed in Supplementary Table 2.) at 16 °C for a duration of 4 h. The unligated linker was eliminated using Lambda Exonuclease (NEB, Cat# M0262L) and Exonuclease I (NEB, Cat# M0293L) at 37 °C for 1 h. The DNA was then reverse-crosslinked and purified using a phenol:chloroform:isoamyl alcohol (25:24:1) extraction. Subsequently, the DNA was fragmented into an average size of 300 bp through sonication, and the biotin-labeled DNA was enriched using Dynabeads™ M-280 streptavidin (Thermo Fisher Scientific, Cat# 11205D). The enriched bead-bound DNA underwent end repair, adapter ligation, PCR amplification, and DNA library construction, followed by sequencing on the Illumina NovaSeq platform (Annoroad Gene Technology Co., Ltd.).
BL-Hi-C data analysis
The adapters were trimmed from raw paired-end reads with Trim Galore, and the linker sequences were removed with the trimlinker tool from the ChIA-PET2 package (version 0.9.3)79. The trimmed sequences were then mapped to the mouse (mm10) genome and processed using HiC-Pro (version 2.11.1)80. The reproducibility of the Hi-C replicates was assessed with HiCRep (version 0.2.6)81. The valid pair files generated by HiC-Pro were transformed into hic files with KR normalization using juicer tools (version 1.122.01)82.
A/B compartments were analyzed by juicer tools with 100 kb resolution. Insulation scores (ISs) were calculated with 50 kb resolution using FAN-C (version 0.9.20)83. ISs were calculated with a window size of 400 kb for brain samples and a window size of 300 kb for heart and lung samples. TAD boundaries were determined by the “fanc boundaries” function with the parameter -s 0.7. The genomic regions that had no mapped reads and the lowest 5% covered reads were combined as low-coverage regions, which were excluded from the insulation score and TAD boundary analysis. The region between two nearby TAD boundaries was defined as the TAD. The statistics from HiC-Pro processes and TAD information are summarized in Supplementary Data 7.
Quantitative high-resolution chromosome conformation capture copy (QHR-4C)
QHR-4C experiments were performed as previously described46. Briefly, digested suspensions of 1 × 10⁵–1 × 10⁶ cells from tissues were cross-linked with 2% w/v formaldehyde for 10 min, and crosslinking was terminated with 0.2 M glycine. The cell pellet was permeabilized by lysis buffer (50 mM Tris-HCl (pH 7.5), 150 mM NaCl, 5 mM EDTA, 0.5% v/v NP-40, 1% v/v Triton X-100), digested with DpnII overnight (NEB, Cat# R0543S) and subjected to proximity ligation by T4 DNA Ligase (NEB, Cat# M0202S). Then, chromatin was reverse-crosslinked and DNA was purified by using MinElute PCR Purification Kit, and was subjected to sonication, resulting in fragmentation into pieces <1000 bp. To enrich ligation events associated with a specific viewpoint, an appropriate amount of sonicated DNA was taken as a template for linear amplification. This process was conducted for 100 cycles using a 5’ biotin-labeled probe of the viewpoint of interest by using Phanta Max Super-Fidelity DNA Polymerase (Vazyme Biotech, Cat# P505). The amplified products were incubated at 95 °C for 5 min, immediately cooled on ice to obtain ssDNA and then enriched with Dynabeads™ M-280 streptavidin. The bead-bound ssDNA was then ligated with adapters. Finally, QHR-4C libraries were constructed with specific primer pairs (forward primers containing Illumina P5 with sequences near a specific viewpoint and reverse primers containing Illumina P7 with an index and sequences matching the adapter) within the system of Phanta Max Super-Fidelity DNA Polymerase and then sequenced on the Illumina NovaSeq platform (Annoroad Gene Technology Co., Ltd.). The primers for QHR-4C used in this study are listed in Supplementary Table 2.
QHR-4C data analysis
Adapter sequences in raw paired-end reads were removed with Trim Galore. The primer sequence at the 5’ end of read 1 was then trimmed with cutadapt (version 3.4)84. Reads that did not contain primer sequences were discarded. Reads were mapped to the mm10 genome using Bowtie2 with the following parameters: –very-sensitive –end-to-end –no-unal -X 2000. Bam files were imported into the r3Cseq package (version 1.38.0)85. Normalized bedgraph files were thus generated and then transformed into bigwig files using the bedGraphToBigWig tool.
Generation of cortical organoids
Cortical organoids differentiated by different genotypes of hESCs were generated as previously described47,48. hESC clones of different genotypes were digested into single cells for subsequent organoid differentiation. Briefly, 9000 cells per well were reaggregated in ultra-low-cell-adhesion 96-well plates with V-bottomed conical wells (Sbio Japan, Cat# MS9096VZ) in cortical differentiation medium (CDM) I. This medium contained Glasgow-MEM (Gibco, Cat# 11710035), 20% v/v Knockout Serum Replacement (KSR) (Gibco, Cat# 10828028), 0.1 mM Minimum Essential Medium non-essential amino acids (MEM-NEAA) (Gibco, Cat# 11140050), 1 mM sodium pyruvate (Gibco, Cat# 11360070), 0.1 mM 2-mercaptoethanol (Life Technologies, Cat# 21985023), and 1% v/v penicillin/streptomycin. From day 0 to day 6, ROCK inhibitor Y-27632 was added to the medium at a final concentration of 20 μM. From day 0–day 18, WNT inhibitor IWR-1 (STEMCELL Technologies, Cat# 72564) and TGF-β inhibitor SB431542 (STEMCELL Technologies, Cat# 72232) were added at concentrations of 3 μM and 5 μM, respectively. From day 18, the floating aggregates were cultured in 6-well ultra-low-attachment culture dishes (Corning, Cat# 3741) on an orbital shaker at 70 rpm in CDM II medium, containing DMEM/F12, 2 mM Glutamax, 1% v/v N2 Supplement (Gibco, Cat# A1370701), 1% v/v Chemically Defined Lipid Concentrate (Gibco, Cat# 11905031), 0.25 μg/mL Amphotericin B (Gibco, Cat#15290026), and 1% v/v penicillin/streptomycin. On day 35, cell aggregates were transferred to the CDM III medium, consisting of CDM II supplemented with 10% v/v FBS, 5 μg/mL heparin (STEMCELL Technologies, Cat# 07980) and 1% v/v Matrigel (Corning, Cat# 356234). From day 70, organoids were cultured on an orbital shaker at 70 rpm in CDM IV medium, consisting of CDM III supplemented with B27 supplement and 2% v/v Matrigel. The cultures were incubated at 37 °C and 5% CO2. And the medium was replaced every 3–5 days. The cortical organoids at different time points of differentiation, were imaged and collected for size quantification, frozen section preparation and RNA-seq experiments, respectively. The organoids were fixed with 4% w/v paraformaldehyde, immersed in 30% w/v sucrose solution, encapsulated in OCT Tissue Freezing Medium, and snap-frozen at -80 °C. Ten-micrometer sections were made using a cryostat microtome (Leica, Germany) at -20 °C for subsequent immunofluorescence staining. Images and area values were obtained with an Olympus inverted microscope. The measured data are provided in the Source Data table. Bulk RNA-seq experiments and data analysis have been described in the previous methods section.
Organoid dissociation and scRNA-seq
A combination of 3–4 similarly sized cortical organoid spheres of the same genotype were subjected to digestion with papain at a concentration of 1 mg/mL for 10 min at 37 °C on a shaker. The digests were gently pipetted and subjected to another 10 min digestion. The resulting cell suspension was filtered through a 40 µm filter and resuspended in a solution of 1% w/v BSA in PBS for cell counting. The scRNA-seq library for cortical organoids was constructed by SequMed Biotech Inc. (GuangZhou, China). Briefly, single-cell suspensions were processed using the DNBelab C Series Single-Cell Library Prep set (MGI, 940-000047-00). Droplet encapsulation, emulsion breakage, mRNA capture, reverse transcription, cDNA amplification, and purification was used to convert the suspensions into barcoded scRNA-seq libraries. After confirmation of the quality, the libraries were sequenced on the DNBSEQ-T7RS platform.
Computational analysis of organoid scRNA-seq data
Cell Ranger (version 6.1.1) with the human reference genome (hg38) was used to generate the output count matrix. Cells with > 20% mitochondrial content, fewer than 300 features, and features expressed in fewer than three cells were excluded from the analysis. We used Scrublet (version 0.2.3)86 and the gene expression patterns (total counts > 40,000) to determine the doublets. The doublet score was calculated independently for each sample with the default settings and with the expected doublet score set at a rate at 10%.
Four organoid scRNA-seq datasets were generated for this study. The cortex region data were extracted from the Allen Brain’s human fetal developmental brain scRNA data, which were used as reference data for cell type annotation. SCANPY (version 1.9.1)87 and Seurat (version 4.3.0)64 were used for major data analysis and visualization. The following steps were performed in order: data normalization, log-transformation, highly variable gene selection, and PCA. The expression levels were calculated as counts per 10,000 (NC); briefly, the total mapped read counts of a gene within one cell were scaled by the number of total mapped reads of that cell and times multiplied by 10,000. The log2(NC + 1)-transformed values were used for further analysis unless indicated otherwise. The highly variable genes were selected based on the raw count data with flavor as “Seurat_v3”. The top 1000 were selected. PCA was run with the selected highly variable genes.
Data integration was performed on the top highly variable genes via Harmony (version 0.0.6)88 with the default parameters. UMAP was performed on the Harmony-corrected PCA embedding. The neighborhood graphs were calculated using scanpy.pp.neighbors, with 15 local neighborhoods and 50 Harmony-corrected PCAs using the mKNN graph. The connectivities were computed using the UMAP method with Euclidean distance. Then, UMAP embedding was performed using scanpy.tl.umap with a minimal effective distance of 0.5, a spread of 1.0, an initial learning rate of 1.0, a negative sample weighting of 1.0 and a negative edge sample rate of 5. Louvain clustering was performed using sc.tl.louvain on the neighborhood calculated in the previous steps, with a resolution of 1, with the vtraag package and with no weights from the mKNN graph. For each cluster, a logistic regression model was trained on the reference dataset and used to annotate organoid cell types. After cell type annotation, the proportions of various cells in each sample were calculated. Milopy (version 0.1.1) was used to calculate and visualize the changes in cell proportions between wild-type and CTCF-mutated cells in 1-month samples.
DEGs for each cell type population between wild-type and CTCF-mutated samples (see Supplementary Data 8) were selected by Seurat via FindMarkers with min. pct = 0.25 and an adjusted p-value < 0.05. GO enrichment analysis was performed on the sets of differentially expressed genes for each cell type using the enrichGO function in the clusterProfiler (version 3.18.1) package.
Statistical analysis
All statistical analyses were performed using GraphPad Prism software. Statistical parameters are reported as sample quantity (n represents the number of animals, cells or organoids per group), and the statistical details of experiments can be found in the figure legends. All data and graphs are presented as mean ± SD, unless stated otherwise. The n-values of statistical samples and the exact p-values are indicated in the figures. The statistical data are provided in the Source Data file.
Reporting summary
Further information on research design is available in the Nature Portfolio Reporting Summary linked to this article.
- SEO Powered Content & PR Distribution. Get Amplified Today.
- PlatoData.Network Vertical Generative Ai. Empower Yourself. Access Here.
- PlatoAiStream. Web3 Intelligence. Knowledge Amplified. Access Here.
- PlatoESG. Carbon, CleanTech, Energy, Environment, Solar, Waste Management. Access Here.
- PlatoHealth. Biotech and Clinical Trials Intelligence. Access Here.
- Source: https://www.nature.com/articles/s41467-024-49684-1