Materials
Fetal Bovine Serum (Bio-Channel, BC-SE-FBS07), DMEM/F-12 (BiologicalIndustries, 01-170-1A), EDTA-Trypsin (Biosharp, BL512A), EndoFectin™Max Reagent (GeneCopoeia, EF013), Cell Value Added-Toxicity Assay Kit (Biosharp, BS350B), PA (Aladdin, S161420), OA (Maclean, S817542), ORO Staining Kit (Solarbio, G1262), BlazeTaq™ SYBR®Green Mix (GeneCopoeia, QP031), Dnase QP031), BCA Protein Reagent (P0009-1, P0009-1), Hematoxylin (Solarbio, H8070), Eosin Staining Reagent (Beyotime, C0105-2), Masson Trichrome Staining Reagent (Solarbio, G1340), TRIzol®Reagent (Life, Cat. no. 15596-018), SureScript™ First-Strand cDNA Synthesis Kit (GeneCopoeia, QP056), Immobilon Western HRP Substrate Luminol Reagent (Affinity, KF001), 30% Acrylamide/Bis solution (29:1) (Solarbio, A1010), 24-well plate (VIRYA, 3512409), FBS(Bio-Channel, BC-SE-FBS07), Hieff® Quick exosome isolation kit Plus (YEASON, China).
Tissue embedding kit (Jiangsu Shitai, 20084), Real-timePCR (Thermo Fisher Scientific, TCR0096, USA), UV spectrophotometer (ALLSHENG, USA), benchtop low-speed centrifuge (Weil Ltd., China), inverted fluorescence microscope (Zeiss, Observer.A1, Germany), gel imager (Monad, USA), ice maker (FM150KE, China), 4 °C refrigerator (Haier, China), baking machine (Thermo Scientific, DB-B2, USA), TEM(ZCIBIO, China), NTA(Particle Metrix, China).
Experimental cells
In this experiment, 5-week male AML-12 mouse hepatocyte lines were selected from Power Science Biotechnology Co. and stored and stably cultured for long periods at Quanport Biological Laboratory. The cells were cultured in DMEM/F12 complete medium (BiologicalIndustries, 01-170-1A), passaged on alternate days, and incubated in a constant temperature incubator at 37 °C and 5% CO2.
Lab animals
Mice
48 specific pathogen Free (SPF) male 6–8 week old C57BL6 mice, weighing 20–25 g, 8 per cage, were purchased from Hunan Slaughter Jingda Laboratory Animal Co. The mice were housed in the experimental animal house of the Institute of Medical Biology, Chinese Academy of Medical Sciences [SYXK (Yunnan) K2022-0006] during the experimental period; the housing environment: temperature 22 ± 1 °C, humidity 65 ± 5% with half-cycle lighting at day and night; the mice were acclimatized and fed for 1 week before the experiment; (All authors confirmed the study is reported in accordance with ARRIVE guidelines;All experiments and methods were carried out in accordance with relevant guidelines and regulations;All procedures performed in studies involving animals were in accordance with the ethical standards of the institution at which the studies were conducted and ethical approval was obtained from [Experimental Animal Ethics Committee of Kunming Yan’an Hospital, 2023004]).
Feed
SPF grade mouse high-fat methionine-choline deficient model feed (HFMRCD) (AIN-76) provided by Beijing Co-operative Feeds Ltd [SCXK (Beijing) 2019-0003] and bedding provided by Jiangsu Medison Biomedical Co; (The relevant human umbilical cord-derived mesenchymal stem cells, exosomes and conditioned culture mediums required for this study were kindly provided by the Central Laboratory of Yan’an Hospital, Kunming, Yunnan Province.)
Cultivation and characterization of hUC-MSCs and CM
The hUC-MSCs were maintained at the Central Laboratory of Yan’an Hospital affiliated with Kunming Medical University, placed in DMEM/F12 complete culture flasks with 10% FBS(Bio-Channel, BC-SE-FBS07), and cultured in a constant temperature incubator at 37 °C and 5% CO2. After the cells were attached to the wall, their adhesion was observed, digested and counted, and they were inoculated into 24-well (VIRYA, 3512409) culture plates at a density of 4X10⁴cells/well. After 2–3 days of culture, cell growth was observed separately. After replacing the lipid-induced medium, osteogenic-induced medium, or chondrogenic-induced medium in a CO2 incubator at constant temperature, the medium was changed every 2–3 days. On the 16th or 21st day of induction culture, the cells were stained with oil red O or alizarin red or toluidine blue for 5 min, washed twice with pure water, and observed and photographed under an inverted microscope (Zeiss, Observer.A1, Germany). Finally, the CM was collected and stored at 4 °C refrigerator (Haier, China), and the collected hUC-MSCs were subjected to flow cytometry to detect the surface markers CD90, CD105, CD73, CD45, CD34, CD19, CD11b and HLA-DR.
Isolation and characterization of hUC-MSCs exosomes
The hUC-MSCs were provided by the Central Laboratory of Yan’an Hospital, Kunming Medical University. hUC-MSCs were cultured in Dulbecco’s modified Eagle’s medium (DMEM; Gibco, USA), and the adherent cells were incubated in 10% fetal bovine serum (FBS)(Bio-Channel, BC-SE-FBS07) under cell incubation conditions (37 °C and 5% CO2) for at least 24 h. Then, the hUC-MSCs culture supernatant was collected, centrifuged(Eppendorf, Centrifuger5418), filtered and concentrated to remove dead cells, cell debris and decontamination. The hUC-MSCs exosomes were extracted from the cell supernatants using the Hieff® Quick exosome isolation kit Plus (YEASON, China) according to the kit instructions, resuspended in sterile PBS(Solarbio, NO. P1003), and stored at − 80 °C (Haier, DW-86L626). The protein concentration of exosomes was determined using the BCA protein assay kit (beyotime, P0009-1). The extracted hUC-MSCs exosomes were characterized by transmission electron microscopy (TEN; ZCIBIO, ZC1099). Particle size was analyzed by nanoparticle tracking analysis (NTA; Particle Metrix, ZetaView), and Western blot was used to detect exosome surface markers TSG101, CD9 and CD63.
In vitro model construction of NASH lipid storage
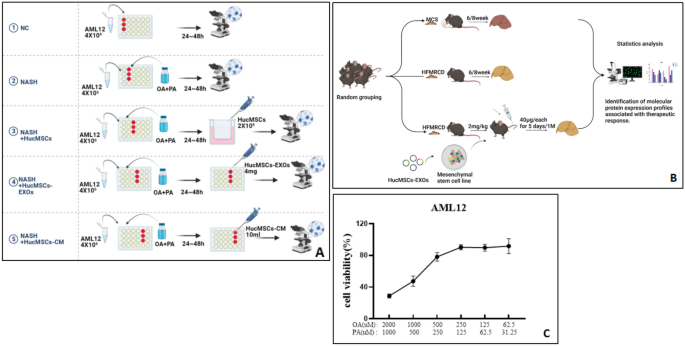
First, AML-12 cells were induced with 2 mM oleic acid (OA) (Maclean, S817542) and 1 mM palmitic acid (PA) (Aladdin, S161420), in sequential fold dilutions for 48 h. Then add 100 μl of medium to 96-well plate (Thermo Fisher Scientific, ASF-0020B5-F10) (30 wells), followed by 50 μl of configured OA preliminary dilution + 50 μl of PA preliminary dilution to B5-F5 (5 wells), sequential dilution (see Supplementary Table 1). The medium in the plate was then aspirated and discarded, and 100 μl of cell medium was added to B2-F3 (10 wells) as a blank control group and a cell control group according to grouping; 100 μl of diluted NAOH medium was added to B4-F4 (5 wells) as a solvent control group; AML12 cells in good growth condition and in logarithmic growth phase were digested and counted, and 1.5 × 10⁵ cells were taken Suspended into 5 ml (30,000 cells/1 ml) and mixed, 100 μl of cell suspension (3000 cells) was added to B3-F10 (in 40 wells) in the plate. Finally, the drug-treated 96-well plate was placed in the incubator and incubation continued for 48 h (note the cell gradient). 10 μl cck8 (Biosharp, BS3508) was added to each well and measurement of absorbance at 450 nm using an enzyme meter (Biotek, ELX800) after 2 h of incubation (see Fig. 1C and Supplementary Table 1).
Cell grouping and experimental intervention
AML-12 cells in logarithmic growth phase were digested and counted and randomly divided into A: Normal, B: NASH model, C: NASH + HucMSCs, D: NASH + HucMSCs-Ex and E: NASH + HucMSCs-CM treatment groups and spread in 24-well plates (VIRYA, 3512409) according to 4X10⁶ AML-12 cells, Groups A, B, C, E 3 wells per group, and one T-25 vial for group D. 1.after the cells were attached to the wall, the medium of groups B, C, D and E was replaced with drug-added medium oleic acid (OA: 500uM)) and palmitic acid (PA: 250uM), and stimulated for 48 h; 2.after 48 h, the drug-added medium was replaced with normal medium; 3.the Huc-MSCs cells were digested and counted, and the cells were spread in the co-culture upper chamber of group C at the amount of 2 × 10⁶ cells HucMSCs cells were digested and counted, and 2 × 10⁶ cells were spread on the C group transwell at a ratio of 1:2 between AML12 and HucMSCs; 4. Replaced the medium of group D with the configured 3 ml Huc-MSCs-Ex (400 μg/ml) solution; 5. Replace group E medium with 3 ml of Huc-MSCs supernatant solution and co-cultivate for 24–48 h, respectively, to detect the molecular or proteomic transfection efficiency for subsequent pathological staining, QP or WB assays (Fig. 1A).
Construction of mouse NASH model and experimental intervention
The mice were randomly divided into 6 groups according to the culture period: (1) 6 weeks normal group, (2) 6 weeks HFMRCD model group, (3) 6 weeks HFMRCD + Ex treatment group, (4) 8 weeks normal group, (5) 8 weeks HFMRCD model group, (6) 8 weeks HFMRCD + Ex treatment group; Prior to the start of formal experiments, mice in the normal group were acclimated to normal chow, while mice in the model and treatment groups were fed a 1: 2 mixture of HFMRCD chow and normal chow on days 1–2; HFMRCD chow mixed with normal chow on days 3–4; HFMRCD chow mixed with normal chow on days 5–7; and HFMRCD chow mixed with normal chow on day 8, and until week 4, week 6, and week 8, the model group was fed HFMRCD and the blank group was fed normal chow during the experimental period. At weeks 4, 6, and 8, mice in the model group were fed HFMRCD; the blank group was fed normal chow during the experimental period.Starting at week 7 or 9, mice in the exosome-treated group received tail vein injections at the maximum tolerated dose of 2 mg/kg (40 µg/mL, once every 5 days) for one month (Fig. 1B)39,41.
After 12 h of fasting after the last injection, blood was collected by Neck dislocation method, weighed and recorded, the thoracic and abdominal cavities were opened, relevant morphological photographs were taken after releasing the liver, and serum and liver tissues were collected for relevant HE、Masson staining or molecular and proteomic transfection efficiency.The liver was then stained with HE staining to observe the structure of liver tissue and the degree of steatosis, and the degree of inflammatory cell infiltration and steatosis was scored and graded according to the NAFLD activity scoring (NAS) system42. The degree of steatosis was graded according to the ratio of area occupied by fat vacuolated degenerated cells/total cells into four grades such as 0, < 1/3, l/3–2/3 and > 2/3, the degree of inflammation (in terms of number of foci of necrosis) within the liver lobules into four grades such as 0, < 2, 2–4 and > 4, and the degree of hepatocellular ballooning was graded according to 0, few, most and /. Samples with a total score ≥ 5 were diagnosed as “NASH”.
Quantitative reverse transcription PCR (RT-qPCR)
Cells were rinsed three times with 2–3 mL of PBS buffer and 1 mL of TRIzol lysate (Life, Cat. No. 15596-018) was added, and total RNA was extracted according to the protocol described by the manufacturer and RT-qPCR was performed as described previously. Reverse transcription was performed using the SureScript™ First-Strand cDNA Synthesis Kit (GeneCopoeia, QP056), followed by BlazeTaq™ SYBR®Green Mix 2.0 (GeneCopoeia, QP031) and specific primers (DynaTech Biotechnology Ltd.) (Supplementary Table 3) for RT-qPCR reactions on a CFX96 quantitative real-time fluorescence PCR instrument (Thermo Fisher Scientific, TCR0096).Data and figure were analyzed using SDSV 2.4 software (Life Technologies).
Western blotting analysis
This gel blot was cut in half for subsequent protein detection prior to antibody hybridization. Afterwards, Samples were run on 10% SDS-PAGE (Solarbio, S8010) and transferred to PVDF membrane (Millipore, K2MA8350E). Membranes were incubated with anti-TNF-α, anti-IL-6, anti-TGF-β1, anti-EI24, anti-AMPK, anti-mTOR, or anti-p62 and anti-LC3B (1: 500) overnight at 4 °C, and the membranes were applied to 1XTBST (Solarbio, 71080) and 5% skim milk (BD, 2271470), washed, incubated with enzyme-conjugated secondary antibody (1:5000 ratio), fully reacted with Immobilon Western HRP Substrate Luminol Reagent (Affinity. KF001) and automatically exposed in gel imaging (Monad. IP0521), and chemiluminescence signal intensity was quantified using imagelab software.
Statistical analysis
Graphpad Prism 6.0 software (California, CA) was used for statistical analysis of the experimental data. The criterion for statistical significance of differences between means was p < 0.05.
Equipment and settings
All column or trend statistical analysis graphs were captured and processed by Graphpad Prism 6.0 software (California, CA); while measured tissue staining images, such as oil red O or HE stained color pictures were first observed and scanned with an inverted microscope, and then uploaded and processed by Image-pro Plus 6.0 software; while Masson images were analyzed and processed by ImageJ software; all WB strip images were processed by gel imager with multiple exposures or using Imagelab software.
ARRIVE guidelines
All authors confirmed the study is reported in accordance with ARRIVE guidelines.
- SEO Powered Content & PR Distribution. Get Amplified Today.
- PlatoData.Network Vertical Generative Ai. Empower Yourself. Access Here.
- PlatoAiStream. Web3 Intelligence. Knowledge Amplified. Access Here.
- PlatoESG. Carbon, CleanTech, Energy, Environment, Solar, Waste Management. Access Here.
- PlatoHealth. Biotech and Clinical Trials Intelligence. Access Here.
- Source: https://www.nature.com/articles/s41598-023-45828-3