Plant materials
Tinospora sagittata is a medicinal tetraploid (2n = 4X = 52) plant that is cultivated for the production of rhizomes, namely Radix Tinosporae (RT, Jinguolan in Chinese) (Fig. 1A). Seeds were collected from Lichuan of Hubei Province, China, one of the areas of RT production. Seeds were planted in a controlled plant growth chamber with 22–25 °C, a relative humidity of 60–70%, and a 16-hour light/8-hour dark photoperiod. The light intensity was approximately 200 μmol/m2/s. After four months of seed germination, when seedlings reached about 20 cm high, they were planted in the research station at Huazhong Agricultural University and managed to keep away from pests. Young and healthy leaves were collected and washed with ultrapure water three times. The washed leaves were immediately frozen in liquid nitrogen and stored at −80 °C before DNA extraction. In addition, young and mature leaves were collected for gene expression profiling experiments and metabolomics, as described below.
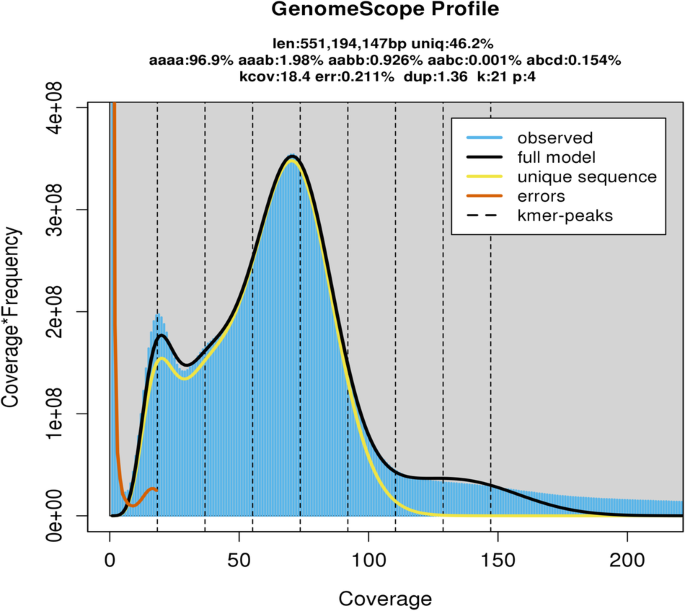
21-mer depth distribution of sequencing reads.
Genome size estimation
The size of the T. sagittata genome was estimated using a k-mer (k = 21) analysis-based approach and Illumina PE short reads. The Jellyfish (v2.1.4) software12 was used to count k-mer in the DNA sample. The GenomeScope13 software was used to estimate the genome size. A 21-mer analysis of the sequenced genome revealed that allotetraploid T. sagittata had a monoploid genome size of ~553.23 Mb and a whole-genome size of 2.33 Gb. The genome’s k-mer distribution displays three distinct peaks, potentially indicative of heterozygous, homozygous, and repeated k-mers. This analysis indicated that the genome of T. sagittata was characterized with a 2.98% heterozygosity (Fig. 1).
Genome sequencing with PacBio technology
Genomic DNA was extracted from fresh leaves using the DNAsecure Plant Kit (TIANGEN), which followed the manufacturer’s protocol. The high-quality DNA samples were sheared to 10 kb in size for amplification according to Megaruptor® DNA Shearing System (PacBio, CA, USA). According to the manufacturer’s instructions, at least 10 μg of sheared DNA was used to construct SMRTbell libraries using SMRTbell Express Template Prep Kit 2.0 (PacBio, CA, USA). In brief, the steps include DNA concentration, damage repair, end repair, ligation of hairpin adapters, and template purification. The resulting SMRTbell libraries with an insert size of 60 kb were sequenced using the P6 polymerase/C4 chemistry combination on the PacBio Sequel platform (Pacific Biosciences, USA) according to the manufacturer’s protocol.
Preparing Hi-C libraries from fresh leaves followed a standard procedure as reported previously14. Five main steps are as follows: (1) cell cross-linking: fixing the samples with formaldehyde, cross-linking intracellular protein and DNA, preserving their interaction, and maintaining the 3D structure in the cell; (2) endonuclease digestion: using HindIII to digest DNA to produce sticky ends on both sides of the cross-link; (3) end repair: using an end repairing to introduce biotin-labeled bases to facilitate subsequent DNA purification and capture; (4) circularization: circularizing the DNA after end repairing and then circularizing the DNA fragments containing interactions to ensure that the position of the interacting DNA is determined during subsequent sequencing and analysis; and (5) DNA purification and capture: decrosslinking the DNA, purifying the DNA, fragmenting it into 300–700 bp fragments, and using streptavidin magnetic beads to capture the DNA fragments containing the interaction relationship for library construction. After the library was constructed, the concentration and insert size (300 bp) of the library were detected using Qubit2.0 and Agilent 2100, respectively, and the effective concentration of the library was accurately quantified using a Q-PCR method to ensure the quality of the library. The Illumina platform was used for high-throughput sequencing, and the sequencing read length was paired-end (PE) 150.
Genome assembly
De novo assembly of sequences followed this pipeline. First, the long reads (60 kb) from the PacBio SMRT Sequencer were assembled using FALCON (https://github.com/PacificBiosciences/FALCON/)15. The longest subreads were selected as seed reads to correct sequence errors. Second, error-corrected reads were aligned to each other and assembled into genomic contigs using the following parameters: length-cutoff-pr = 10,000, max-diff = 95, and max-cov = 105. All genomic contigs were polished according to Quiver16. Third, based on the Illumina sequencing reads, tools of Pilon17 were used to correct errors. Fourth, sequences from the Hi-C sequencing were aligned to the assembled scaffolds according to BWA-MEM18. Finally, the scaffolds were clustered onto chromosomes according to LACHESIS (http://shendurelab.github.io/LACHESIS/)19. The sequencing with the PacBio Sequel II yielded 2.5 million CCS reads (average length 15.7 kb) with a total data volume of 43 Gb. The PacBio long reads were corrected and assembled with a hybrid assembly strategy before using 11.25 Gb of Illumina sequencing (short reads) for polishing (Figs. S1 & 2, Tables S1–4). The assembly of short reads from the Illumina sequencing and PacBio long reads resulted in 4483 contigs (N50 = 8.3Mbp) with a total of 1299.6 Mbp, in which the maximum length was 31.9Mbp and the GC content was 36.36% (Table 1).
After polishing PacBio long reads with Illumina short reads, the assembly was further scaffolded with Hi-C. The scaffolding results obtained 4070 scaffolds (N50 = 42.06 Mb). Subsequently, 960.8 million reads with 287,909.2 Mbp clean Hi-C paired-end reads were used for scaffold extension and anchoring. The Hi-C assembly and manual adjustment of the heatmap obtained 1,196.2 Mbp of genomic sequences, accounting for 92.05%, which were used for mapping to the 26 chromosomes. The results showed that 1,132.3 Mbp out of 1,196.2 Mbp (accounting for 94.66%) were mapped to the 26 chromosome sequences. A further sequence analysis obtained 572.7 Mb of reads uniquely aligned to the genome. In these unique sequences, 399.5 Mb (accounting for 69.75% of the uniquely aligned reads) were valid Hi-C data visualized with a heatmap (Fig. 2B, Table 1, Tables S5, S6). The 26 chromosomes were clearly distinguished in the heatmap to form 4070 unique groups. In each group, the intensity of the interaction at its diagonal position was higher than that at the non-diagonal position, indicating that those chromosomes assembled by Hi-C were adjacent to each other. The heat map also showed that the interaction signal strength between the sequences at the diagonal position) were strong, while that between non-adjacent sequences at off-diagonal positions was weak (Fig. 2B, Fig. S3). This result is consistent with the principle of Hi-C-assisted genome assembly. Based on the assembly of the chromosome-based genome, the analysis with the Circlize software provided chromosome ideograms, transposon elements (TE) density, gene density, GC content, repeat density, density of LTR elements, density Copia transposons, density of Gypsy transposons, density of DNA transposons and collinearity between the chromosomes (Fig. 2Ca–i).
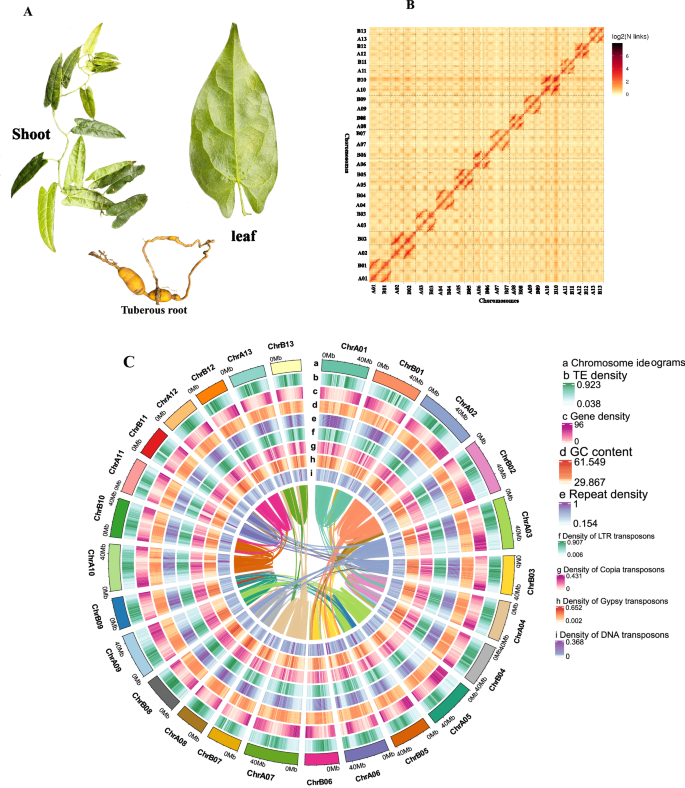
Main features of genome assembly of T. sagittata. (A) Three types of tissues of T. sagittata were collected from a research station at Huazhong Agricultural University, Hubei Province, China. (B) An interaction heat map of Hi-C assembled chromosomes. (C) Distribution features of the assembled genome are shown by four types of elements arranged from outer (a) to inner (i), (a) chromosome ideograms, (b) transposon elements (TE) density, (c) gene density, (d) GC content, (e) repeat density, (f) density of LTR elements, (g) density Copia transposons, (h) density of Gypsy transposons, and (i) density of DNA transposons.
Genes annotation
We annotated gene functions using homology-based, de novo, and transcriptome-based predictions. First, homolog proteins from four plant genomes (Arabidopsis thaliana, Coptis chinensis Franch, Macleaya cordata, and Aquilegia coerulea) were downloaded from Ensemble Plants (http://plants.ensembl.org/index.html). Protein sequences from these genomes were aligned to the T. sagittata genome using TblastN20 with an E-value cutoff of 1e−5. The BLAST hits were conjoined with the Solar software21. GeneWise22 was used to predict the exact gene structure of the corresponding genomic regions for each BLAST hit (Homo-set). Second, for transcriptome-based prediction, RNA-seq data were mapped to the assembled genome using TopHat (version 2.0.8)23 and Cufflinks (version 2.1.1)24, and then the transcripts were assembled into gene models (Cufflinks-set). Third, RNA-seq data were assembled with Trinity25 and then used to create several pseudo-ESTs. These pseudo-ESTs were also mapped to the assembled genome, and PASA-predicted gene models were predicted using PASA26. Five ab initio gene prediction programs, AUGUSTUS (version 2.5.5)27, GenScan (version 1.0)28, GlimmerHMM (version 3.0.1)29, GeneID30, and SNAP31, were used to predict coding regions in the repeat-masked genome. Finally, gene model evidence from the Homo set, Cufflinks-set, PASA-T-set, and ab initio programs were combined via EvidenceModeler (EVM)32 to obtain a non-redundant set of gene structures. BLASTP33 (with an E-value cutoff of 1e−5) was performed via two integrated protein sequence databases: SwissProt (https://web.expasy.org/docs/swiss-prot_guideline.html) and NR. Protein domains were annotated by searching against the InterPro (V32.0)34 and Pfam (V27.0)35 databases using InterProScan (V4.8)36 and HMMER (V3.1)37 were used to predict the function of protein-coding genes. Gene Ontology (GO) terms were obtained from the corresponding InterPro or Pfam entry. BLAST assigned genes likely involved in the biosynthesis of the secondary metabolite against the KEGG databases with an E-value cutoff of 1e−5. Genes encoding tRNA were identified with the tRNAscan-SE software38. The rRNA fragments were predicted by aligning transcripts to the rRNA sequences using BlastN with an E-value cutoff of 1e−10. Those cDNAs encoding miRNA and snRNA were predicted with INFERNAL software39 against the Rfam database (release 9.1)40.
Homology-based, Ab-initio-based, and RNAseq-based methods were used to predict protein-coding genes. After removing theoretical nonfunctional genes, 52,953 protein-coding genes were obtained from the assembled genome (Table S7). Among the predicted genes, 1047, 3788, and 10 were unique in homology-based, Ab-initio-based, and RNAseq-based, respectively (Fig. S4). Tissue-specific RNA-seq was completed to develop transcriptomes. The resulting data showed that the average length of coding sequence genes was 6203.59 bp. The average coding sequence (CDS) length was 1360.42 bp, with an average of five exons and four introns per gene (Table 2). Approximately 97.93% of the genes were functionally annotated, of which 96.91% and 97.79% had significant hits in the NR and TrEMBL databases, respectively. Gene Ontology terms classified 82.91% of the genes. KEGG pathways annotated 75.21% of the genes (Table S8). These results indicate the high accuracy of the gene predictions in the T. sagittata genome. We further annotated noncoding RNA, yielding 9,624 transfer RNA genes, 13,014 ribosomal RNA genes, 350 small nuclear RNA genes, and 292 microRNA genes, as well as 287 pseudogenes in the T. sagittata genome (Tables S9–11). Next, we combined RNA-seq and full-length transcriptome data from four tissues and organs (leaf, rhizome, roots, and stem) with three biological replicates. At least 6.36 Gb of clean data were generated for each sample, with a minimum of 94.02% clean data, achieving a quality score of Q30. Clean reads of each sample were mapped to a specified reference genome. The mapping ratio ranged from 89.11% to 93.96% (Table S12).
Repeat regions prediction
Transposable elements (TEs) in the T. sagittata genome were searched by combining de novo-based and homology-based approaches. The de novo approach was completed with the RepeatModeler (http://www.repeatmasker.org/RepeatModeler/), LTR_FINDER (http://tlife.fudan.edu.cn/ltr_finder/), and RepeatScout (http://www.repeatmasker.org/) software to build a repeat library. The homology-based approach was carried out with the RepeatMasker (version 3.3.0) (http://www.repeatmasker.org/) software against the Repbase TE library and RepeatProteinMask (http://www.repeatmasker.org/) software against the TE protein database. Tandem repeats were detected in the genome using the Tandem Repeats Finder (TRF) software41. A total of 1,119,004 (51.72%) reads with a length of 672.2 Mb of the assembly were masked and annotated as repetitive elements (Figs. 2Ce-I, 3A), of which 45.13% was retroelement, while 6.59% was DNA transposon. Long terminal repeat (LTR) accounted for 41.85% of the repetitive elements, and long interspersed nuclear elements (LINE) were 2.92%. Interestingly, most LTRs were Gypsy and Copy elements (constituting 18.55% and 14.39% of the T. sagittata genome), and 8.32% comprised unknown LTR repeats (Table S13). About 91 Mb of tandem repeats were obtained, accounting for 7% of the genome (Table S14). The repeated element in the T. sagittata genome has experienced continuing amplification from 2 Mya (Fig. 3B).
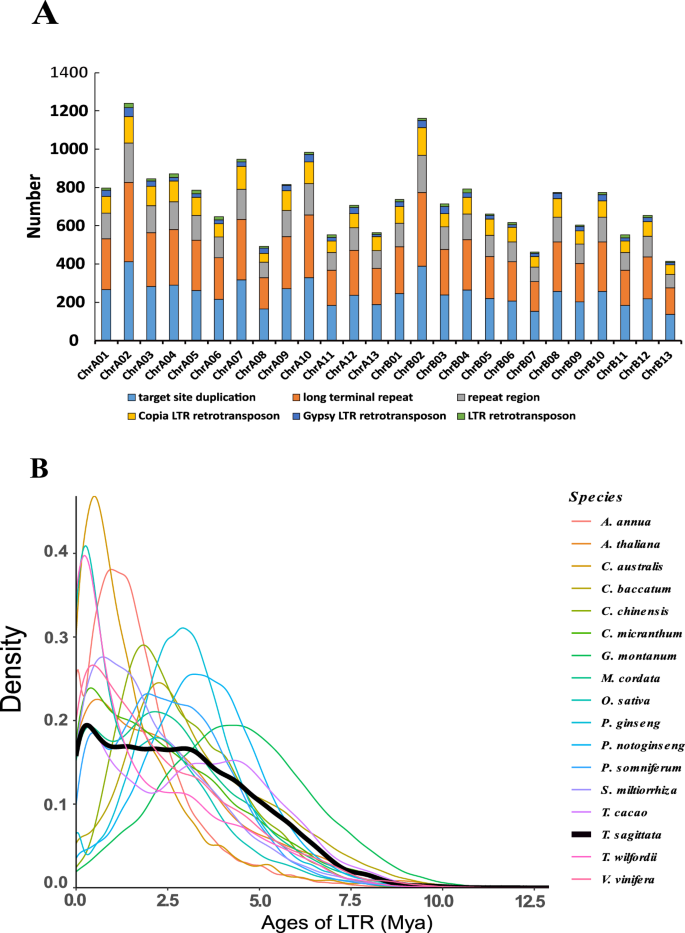
The distribution of insertion time of intact LTRs in T. sagittata. (A) Genomic constituents of LTR. The column represents the number. (B) Temporal patterns of LTR-RT insertion bursts in T. sagittata, compared with those in other 16 species.
- SEO Powered Content & PR Distribution. Get Amplified Today.
- PlatoData.Network Vertical Generative Ai. Empower Yourself. Access Here.
- PlatoAiStream. Web3 Intelligence. Knowledge Amplified. Access Here.
- PlatoESG. Carbon, CleanTech, Energy, Environment, Solar, Waste Management. Access Here.
- PlatoHealth. Biotech and Clinical Trials Intelligence. Access Here.
- Source: https://www.nature.com/articles/s41597-024-03315-y