Ethical considerations of working with human cells and animals
Our research complies with all relevant ethical regulations. All studies based on human pluripotent stem cells were approved by the Korean Public IRB (IRB numbers: P01-201409-ES-01-09, P01-201609-31-002). Six-to–twelve weeks old male NIG mice (NOD/SCID deleted IL2Rg gene) obtained from GHBio Korea were maintained under specific-pathogen-free condition. All animal experiments were approved by the Institutional Animal Care and Use Committee (IACUC) of KRIBB (approval number: KRIBB-AEC-21236).
Human pluripotent stem cells
The H9 hESC line was purchased from WiCell Research Institute (Madison, WI, USA). The generation of hiPSC and culture methods of hESC and hiPSCs have been described in a previous report40. Briefly, hESCs and iPSCs were maintained on Matrigel (BD Biosciences) in mTesR1 medium without feeders, and routinely passaged every week.
Differentiation of hPSC into hIO
The hIO differentiation method has previously been described in detail22,23. hPSCs were differentiated into definitive endoderm (DE) by treatment with 100 ng/ml activin A (R&D Systems, Minneapolis, MN, USA) for 3 days in RPMI 1640 medium with increasing concentrations of 0%, 0.2%, and 2% defined foetal bovine serum (FBS; Gibco, Cat. No. 16000044, Thermo Fisher Scientific Inc., Waltham, MA, USA). DE cells were then treated for 4 days with RPMI 1640 medium containing 2% dFBS, 500 ng/ml FGF4 (Peprotech, Cat. No.100-31-500, Thermo Fisher Scientific Inc., Waltham, MA, USA), and 500 ng/ml WNT3A (R&D Systems, Cat. No.5036-WN-500, R&D Systems, Minneapolis, MN, USA) to promote differentiation into 3D hindgut spheroids. The spheroids were harvested and embedded in Matrigel (Matrigel® Basement Membrane Matrix, LDEV-free, Cat. No. 354234, Corning, NY, USA), cultured in hIO medium composed of advanced Dulbecco’s Modified Eagle Medium (DMEM)/F-12 medium (Gibco, Cat No. 11330-099, Thermo Fisher Scientific Inc., Waltham, MA, USA) containing 1× B27 (Invitrogen, Cat No. 12587-010, Thermo Fisher Scientific Inc., Waltham, MA, USA), 500 ng/ml R-Spondin 1 (Peprotech, Cat. No. 120-38), 100 ng/ml EGF (R&D Systems, Cat. No. 236-EG-01M), and 100 ng/ml Noggin (R&D Systems, Cat. No. 6057-NG-01M), and then passaged every 2 weeks. For in vitro maturation, hIO medium containing recombinant human interleukin 2 (R&D Systems, Cat. No. 202-IL-010) was used for two passages.
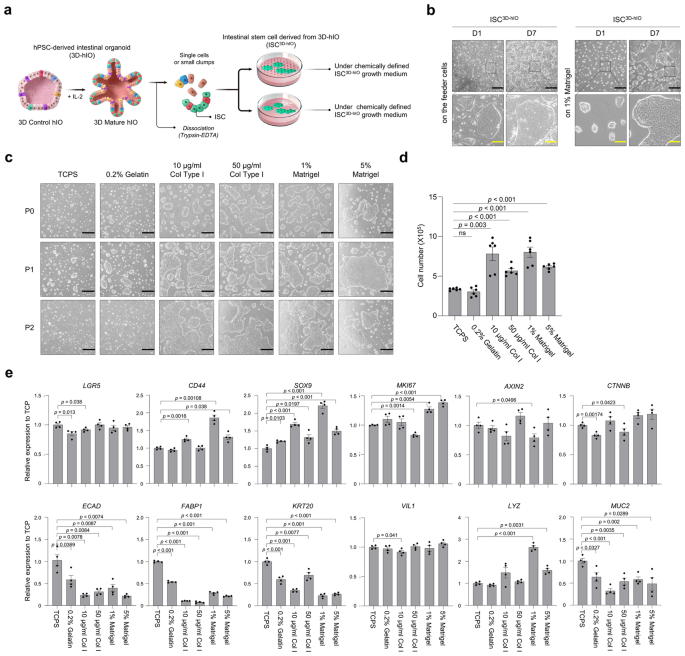
Isolation and culture of ISC3D-hIO
The hIOs were dislodged from the Matrigel dome and pipetted up and down to remove the remaining Matrigel fragments surrounding the hIOs. For at least 5 min in a 37 °C water bath, hIOs were digested in 1 ml of 0.25% trypsin-EDTA (Gibco, Cat. No. 25200-072). At the end of digestion, the cells were gently pipetted up and down to break up any aggregated clumps. Four to five rounds of pipetting were sufficient for cell dissociation. Excessive dissociation results in diminished recovery of ISC3D-hIO. ISC3D-hIO basal medium (10 ml) was added and centrifuged at 1250 × g for 5 min. The supernatant was carefully discarded, and the pellet was suspended in ISC3D-hIO transfer medium (supplemented with 1 µM Jagged-1 (Anaspec, Cat. No. ANA-AS-61298, Apaspec, Fremont, CA, USA) and 10 µM Y-27632 (R&D Systems, Cat. No. 1254/10) to ISC3D-hIO growth medium). The cells were seeded onto a 35 mm cell culture dish pre-coated with 1% Matrigel or MMC-treated MEF feeder cells. The ISCs3D-hIO were cultured at 37 °C in a 5% CO2 incubator. The ISC3D-hIO full growth medium (supplemented with 2% B27, 10 nM [Leu15]-Gastrin I (Sigma-aldrich, Cat. No. G9145, Merck, Saint Louis, MO, USA), 100 ng/ml Wnt3A, 100 ng/ml EGF, 100 ng/ml Noggin, 500 ng/ml R-Spondin 1, 500 nM A-83-01 (Tocris, Cat. No. 2939, Tocris, Bristol, UK), 10 µM SB202190 (Sigma-aldrich, Cat. No. S7067), 2.5 uM PGE2 (Sigma-aldrich, Cat. No. P0409), 1 mM N-acetylcysteine (Sigma-aldrich, Cat. No. A9165), and 10 mM nicotinamide (Sigma-aldrich, Cat. No. N0636) to ISC3D-hIO basal medium) was replaced every 2 days. The ISCs3D-hIO were passaged at a 1:2 or 1:3 split ratio every 7 days.
ISC3D-hIO differentiation into the intestinal epithelium
Prepare the Transwell inserts in a 12-well plate by coating them with 250 µl of 1% Matrigel in cold ISC3D-hIO basal medium (2 mM L-glutamine (Gibco, Cat No. 25030-081), 15 mM HEPES (Gibco, Cat No. 15630-080), and 1% penicillin/streptomycin (Gibco, Cat No. 15140-122) in Advanced DMEM/F-12 medium (Gibco, Cat No. 12634-028)). The plate was gently shaken to ensure the Matrigel solution evenly covered the insert surfaces. Then, the plate was incubated for at least 1 h in an incubator at 37 °C with 5% CO2. Dissociated ISCs3D-hIO (2.5–3.5 × 10⁵) were seeded onto the Transwell inserts. The ISCs3D-hIO were incubated at 37 °C and 5% CO2, and the ISC3D-hIO full growth medium was changed every 2 days. At confluence, the medium was removed from the inserts by careful pipetting to create an ALI culture. The medium was changed from the outer well plate to the defined minimal medium for ALI differentiation (supplemented with 100 ng/ml EGF, 500 ng/ml R-Spondin 1, 10 µM SB202190, 2.5 µM PGE2, and 10 mM nicotinamide to ISC3D-hIO basal medium) and incubated in an incubator at 37 °C and 5% CO2. The defined minimal medium was changed every 2 days, and the culture was continued for an additional 6–10 days to induce differentiation. The structural development of 2.5D intestinal epithelium was manually analysed by using Image J software. To assess the structural development of 2.5D intestinal epithelium within each condition, we calculated the percentage of structural development of 2.5D intestinal epithelium per image by manually dividing the pixels in the area considered visually similar to the epithelium.
EdU incorporation assay
The ISC3D-hIO was plated onto 4-well chamber slides (Nunc, Cat No. 177437, Thermo Fisher Scientific Inc., Waltham, MA, USA). After cell attachment in full medium for 2 days, the ISC3D-hIO was grown for 4 days in each growth factor-depleted medium. The ISC3D-hIO was then grown for 24 h in each medium containing 10 μM EdU (Invitrogen, Cat No. C10640). EdU-incorporated ISC3D-hIO was fixed in 4% paraformaldehyde in Dulbecco’s phosphate buffered saline (without Ca2+ and Mg2+). The EdU-positive cells were labelled with the fluorescent dye picolyl azide probe followed by the manufacturer’s instructions. For co-staining, samples were labelled by KI67 primary antibody (1:100, BD Bioscience, Cat No. 556003, BD Bioscience, Becton, NJ, USA), which was diluted in 4% bovine serum albumin (BSA, Bovogen Biologicals, Cat No. BSA100, Victoria, Australia) in PBS and DAPI (4’,6-diamidino-2-phenylindole dihydrochloride, Invitrogen, Cat No. D1306) for labelling nuclei. The KI67+ and BrdU+ cells were counted independently in three ISC colonies.
LIVE/DEAD fluorescence assay
The viability of the ISC3D-hIO was measured using a calcein-AM/Ethidium homodimer 1 LIVE/DEAD assay kit (Invitrogen, Cat No. L3224). After cell washing with DPBS, the optimal volume of staining solution was added according to the manufacturer’s instruction, and cells were imaged using a fluorescent microscope (EVOS FL Auto 2, Thermo Fisher Scientific Inc.). The live and dead cells were manually counted, and the ratio of live cells to the total number of cells was used to calculate the survival rate of the ISC3D-hIO.
Whole genome sequencing
For whole genome sequecing of ISC3D-hIO (passage 8, 27, and 54), 100 ng of genomic DNA was used to construct DNA library with TruSeq Nano DNA (Illumina, USA) following the manufacturer’s instruction. Multiple libraries were sequenced on an Illumina NovaSeq 6000 using paired-end 150, 6 G reads. Reads were aligned to the reference genome Trimmomatic was used to remove low quality reads to reduce bias. Map the reads to the reference genome (hg38 from UCSC) of choice Burrows-Wheeler Aligner (BWA)41. Properly mapped reads were extracted from BAM files after duplicated reads were removed. ngCGH (version 0.4.4) was used to compare two matched BAM data with a window size of 10 kb for copy number estimate. Then, the copy number altered regions were defined by segmentation of the genome using DNAcopy (version 1.74.1)42.
Single-cell RNA-sequencing (scRNA-seq)
For scRNA-seq, three independently grown ISC3D-hIO cultures were pooled at equal numbers. The ISCs3D-hIO were washed three times with Dulbecco’s phosphate buffered saline (without Ca2+ and Mg2+) and treated with 1 ml of 0.25% trypsin-EDTA for 10 min. After cell dissociation, the cell suspension was filtered through a 40-µm cell strainer (Falcon, Cat. No. 352340, Corning, NY, USA) to remove cell aggregates. Single-cell suspensions were washed and resuspended in 0.04% BSA in PBS. Cell viability was determined by trypan blue staining (Gibco, Cat No. 15250-061) and calculated automatically using a Countess™ II system (Thermo Fisher Scientific Inc.). Library construction was performed using the Chromium Next GEM Single Cell 3’ reagent kit v3.1 (10X Genomics) according to the manufacturer’s protocol. Briefly, the cells were diluted into Chromium Next GEM Chip G to yield approximately 20,000 single cells. Following library preparation, the libraries were sequenced in multiplex on a Novaseq 6000 sequencer (Illumina) to produce 82,712 reads and 5214 genes per single cell.
scRNA-seq data analysis
The 10X Genomics software CellRanger (version 3.1) was used to process the raw sequencing data and create gene expression matrices with default parameters. We used published scRNA-seq data from the human intestine from foetal to adult -generated by refs. 18,19, which contained several clearly defined cell populations of reasonable size, to establish a basic cluster of cell types. In other words, it is a relatively large scRNA-seq dataset with excellent annotation. Among them, only the epithelial data of the small intestine of the foetus (6–10 weeks) was selected for comparison with our data. The scRNA-seq analysis was performed using the Scanpy package v1.8. First, predicted doublets were excluded from the analysis using the Scrublet doublet detection pipeline with a threshold of 0.25–0.3. In addition, cells with fewer than 200 genes and greater than 8000 genes were filtered to remove empty droplets and probable doublets, respectively. To account for differences in sequencing depth across samples, we normalised the library size by first dividing the UMI counts by the total UMI counts in each cell and then multiplying by 10,000. For cell clustering, we used marker genes identified by refs. 18,19. with a resolution of 0.4. The scRNA-seq data from this study was integrated using the same method. To confirm the expression of specific marker genes, a normalised dataset without gene filtering was used after dimensionality reduction. We used Spearman’s correlation generated by ref. 18. with the scRNA-seq data from this study to estimate the degree of differentiation.
Bulk RNA-sequencing
The RNA samples were analysed using an Agilent 2100 Bioanalyzer system (Agilent Technologies, Santa Clara, CA, USA). Only high-quality RNA samples (RNA integrity number ≥7.5) were applied in the subsequent preparation of mRNA samples for sequencing. An Illumina TruSeq RNA Sample Preparation Kit v2 (Illumina, San Diego, CA, USA) was used with approximately 0.5–4 µg of total RNA to generate the libraries according to the manufacturer’s specifications. RNA sequencing was conducted with an Illumina HiSeq2500 (Illumina, San Diego, CA, USA) following the standard Illumina RNA-Seq protocol by paired-end sequencing with a read length of 100 base pairs.
Bioinformatic analysis
The NGSQCToolkit v.2.3.3 was used to evaluate the sequence data, Cutadapt v.1.18 were used to trim the adapter sequence from the sample data with the default settings (minimum length = 50 bp, Phred quality threshold score >20). After preprocessing the raw reads, trimmed RNA-seq reads were alligned to the reference genome (GRCh38) using HISAT2 v.2.0.5 with default parameter settings and applying StringTie v.2.1.0, using the reference annotation file to estimate the expression levels of all genes. The expression levels for each transcript were normalised to calculate the sum of mean fragments per kilobase of transcripts per million (FPKM). If the maximum values of this sum across all samples were below 1, the gene was discarded. For identification of DEGs, differences in FPKM values calculated by Cuffdiff were considered significant when the p value was less than or equal to 0.05 and the absolute fold change value was equal to or greater than 2. Using all the protein-coding genes, multidimensional scaling (MDS) analysis was performed to cluster the samples according to their overall similarity of gene expression patterns to determine whether the gene expression patterns between the phenotypic classes could be clearly distinguished. For MDS analysis, the pairwise distances between the samples were determined using the function “dist” (maximum distance measure) in the R v.4.0.2 statistical programming language and plotted using R. The log2 transformation values were used for this analysis, and rows with zero expression in all samples were eliminated. Furthermore, the “hclust” function of the stats package v.3.6.2 was used to perform hierarchical clustering using the maximum distance, and adult small intestine RNA-seq data were downloaded from the public database under accession E-MTAB-1733.
Lentiviral infection of ISC3D-hIO
eGFP-expressing lentivirus (EF1α-Gene X-IRES2-EGFP-IRES-Puro) was purchased from GeneCopoeia (MD, USA). Approximately 2–4 × 10⁵ ISCs3D-hIO were infected with the ISC3D-hIO transfer medium supplemented with 8 µg/ml polybrene by centrifugation (5000 × g for 90 min) in 12-well plates. After centrifugation, a fresh ISC3D-hIO transfer medium was added. After 48 h of lentiviral infection, 1 µg/ml puromycin was added to the ISC3D-hIO growth medium. To isolate single-cell pedigree lines, trypsinised single cell suspensions were sparsely seeded onto a 1% Matrigel-coated plate. Pedigree lines derived from single cells were obtained after clonogenic cell expansion using a collagenase IV and dispase mixture.
Xenotransplantation and colonoscopy
Male NIG mice (NOD/SCID deleted IL2Rg gene, 6–12 weeks old; GHBio, Daejeon, Korea) were used in the experiments. The mice were used as a hot EDTA-induced colonic epithelial injury model, as previously described7. For orthotopic xenotransplantation, ISCs3D-hIO was grown for 4–6 days before being dissociated with trypsin-EDTA. The ISCs3D-hIO (1–5 × 10⁶ cells) were suspended in Matrigel/Advanced DMEM/F-12 (1:10). A Hundred microliters of ISCs3D-hIO suspension was injected into the injured colonic lumen using a colonoscopic injector (Image 1 Hub HD H3-Z; D-Light C; Rigid HOPKINS telescope; Karl Storz, Tuttlingen, Germany; and optimised injector; Vetcom, Gwacheon, Korea) (Matrigel group, n = 6; ISCs3D-hIO group, n = 10). After transplantation, the anal verge was glued with Vetbond Tissue Adhesive (3 M, MN, USA) for 6–12 h. The mice were weighed daily. Each mouse received a colonoscopic examination to track the engraft site at 0, 3, and 14-day post-transplantation. The mice were euthanised on day 14, and the colons were isolated for analysis7.
In vivo fluorescence imaging
The visualised ISCs3D-hIO xenografts, ISCs3D-hIO, were stained with 1,1-dioctadecyl-3,3,3,3-tetramethylindotricarbocyanine iodide (DiR, Invitrogen, Cat No. D12731) and xenotransplanted into the EDTA-induced injured colonic lumen. On day 14, the recipient colon was isolated. The colons were monitored using the in vivo imaging system (IVIS Lumina II, Xenogen Corp., CA, USA) at 780 nm (emission)/750 nm (excitation) and were observed using a fluorescent microscope (EVOS FL Auto 2, Thermo Fisher Scientific Inc.)
Fluorescent stereomicroscopy
To confirm the ISCs3D-ISX-eGFP-hIO xenografts, images were acquired using a stereo microscope (SZX16, Olympus, Japan) with bright field and fluorescence (GFP filter). On day 14, the isolated colon tissues were visualised under the same intensity of light and GFP.
Histopathological analysis
The recipient colon tissues were isolated on 14-day PT, fixed with 10% formalin (Sigma-Aldrich, MO, USA), and incubated with 15–30% sucrose for cryopreservation. Xenograft colons were embedded in Tissue-Tek O.C.T. (Sakura Finetek, Cat No. 4583, Sakura Finetek, CA, USA) compound and sectioned at 10 μm. The tissues were stained with haematoxylin and eosin for histological analysis. For histopathological analysis, Alcian Blue (Abcam, Cat No. 150662, Abcam, Cambridge, UK)-Periodic Acid Schiff (Sigma-aldrich, Cat No. 1.01646.0001) staining was performed on 10-μm colon sections. AB-PAS-stained sections confirmed mucus-secreting goblet cells and mucin. Sections were observed using a microscope (BX53; Olympus, Tokyo, Japan). The colon crypt depth was measured in H&E-stained images using Image J software (Matrigel group, n = 675 crypts; ISCs3D-hIO group, n = 705 crypts).
Immunofluorescence analysis
The cells were rinsed with cold PBS and fixed with 4% paraformaldehyde (PFA, Sigma-Aldrich, Cat No. HT501128) for 15 min at room temperature. Then, the cells were permeabilized with PBS containing 0.1% Triton X-100 (Sigma-Aldrich, Cat No. X100) and blocked with 4% BSA solution for 1 h at room temperature. Then, the cells were incubated overnightin in a humid chamber at 4 °C with specific primary antibodies. After incubation, the cells were washed with PBS containing 0.05% Tween 20 (Sigma-Aldrich, Cat No. 1379) and incubated with the secondary antibody for 1 h in the dark. Nuclei were counterstained with 1 mg/ml of DAPI, and cover slips were mounted using fluorescent mounting medium (Dako, Cat No. S3023, Carpinteria, CA). The fluorescence was examined using a confocal microscope (LSM800, Carl Zeiss, Oberkochen, Germany) and a fluorescence microscope (IX51, Olympus, Japan). The xenograft colon sections were incubated with the E-cadherin (R&D systems, Cat No. AF648) and human-specific cytokeratin (BD Biosciences, Cat No. 349205) antibodies overnight at 4 °C. After washing with PBS containing 0.05% Tween 20, the sections were incubated with fluorescently labelled secondary antibodies for 1 h in the dark. Nuclei were counterstained with DAPI. The stained tissues were examined using an EVOS FL Auto 2 system and a confocal microscope (FV1000, Olympus, Tokyo, Japan). The intensity of hCytokeratin+ and DAPI in the xenograft colon were measured with ImageJ 1.53e software. To quantify ALI 4d, 8d, and 12d epithelium thickness, 10 µm sections were stained with an epithelium-specific antibody (ECAD) antibody and imaged using a 20× objective microscope (Olympus). ECAD+ epithelium thickness was randomly measured in 48 areas across three independent sections for each field of view using ImageJ 1.53e software. Additional information on the antibodies used can be found in Supplementary Table 2.
Quantification of epithelium thickness
The epithelium thickness was randomly quantified straight-line of apical-to-basal measurement in ECAD stained cross-section images by using Image J software. The thickness values were taken from a total of 48 regions in three biological independent sections on days 4, 8, and 12.
RNA extraction
Cell culture media was removed from culture dishes or plates, and cells were 2–3 times washed with Dulbecco’s phosphate-buffered saline (DPBS) containing 0.1% diethyl pyrocarbonate (DEPC). After removing the washing buffer, cells were incubated for 5–10 min with trypsin-EDTA at 37 °C and 5% CO2. After incubation, cells were harvested by centrifugation at 1250 × g for 5 min at RT. RNA was extracted from the cell pellet using a RNeasy kit (Qiagen, Cat No. 74106, Qiagen, Hilden, Germany) followed by the manufacturer’s instructions, and then subsequent RNAs obtained were stored at −80 °C.
Quantitative reverse transcription-polymerase chain reaction (qPCR)
cDNA was synthesised by a Superscript IV cDNA synthesis kit (Invitrogen, Cat No. 18090-050) according to the manufacturer’s instruction. A quantitative polymerase chain reaction (qPCR) was performed using the 7500 Fast Real-Time PCR system (Applied Biosystems, Foster City, CA, USA). The relative expression was calculated based on the ΔΔCt method. RNA extracted from the adult human small intestine (hSI) (Clonetech, Cat No. 636539, Takara, Fremont, CA, USA) was used as a positive control. Primers used in this study are listed in Supplementary Table 3.
Measurement of transepithelial electrical resistance (TEER)
TEER measurements were carried out using an epithelial tissue volt/ohmmeter (EVOM2, WPI, Sarasota, FL, USA) according to the manufacturer’s instructions.
SARS-CoV-2 and cell lines
African green monkey kidney epithelial Vero E6 cells were purchased from the American Type Culture Collection (ATCC CRL-1586; Manassas, VA, USA), and the SARS-CoV-2, KCDC03 (isolated from Korean COVID-19 patient in 2020 and belonging to the A lineage of early Chinese strains), was kindly provided by the National Culture Collection for Pathogens in Korea. The Vero E6 cells were grown in Dulbecco’s modified Eagle’s medium (DMEM, Gibco) supplemented with 5% FBS (Gibco) and 1% antibiotic-antimycotic (Gibco, Cat No. 15240-062) at 37 °C with 5% CO2. The SARS-CoV-2 KCDC03 strain was propagated in Vero E6 cells in the presence of 1 μg/ml tosyl phenylalanyl chloromethyl ketone (TPCK) trypsin (Sigma-Aldrich, Cat No. 4370185).
Virus culture
The SARS-CoV-2 was propagated in Vero cells in DMEM without FBS with 1% antibiotic-antimycotic and TPCK trypsin (final concentrations of 1 μg/ml) for 72 h at 37 °C with 5% CO2. Propagated viruses were stored in a freezer at −80 °C for future use. Infectious virus titre were determined using a 50% tissue culture infective dose (TCID50) in confluent cells in 96-well microplates. All SARS-CoV-2 experiments were carried out in the KCDC-approved Biosafety Level 3 (BL-3) facility of the Korea Research Institute of Bioscience and Biotechnology (KRIBB) in accordance with institutional biosafety requirements (KRIBB-IBC-20200215).
Virus inoculation and RNA extraction
The SARS-CoV-2 strain was inoculated onto intestinal epithelial cells (2.5–3.5 × 10⁵ cells/well) for 1 h with occasional rocking at a multiplicity of infection (MOI) of 0.01, 0.001. The medium in the transwell inserts was removed and replaced with fresh minimal medium for ALI differentiation after the incubating plates at 37 °C with 5% CO2. The minimal medium was removed 72 h after infection, and total cellular RNA was harvested using the QIAmp Viral RNA Mini kit (Qiagen, Cat No. 52904) following the manufacturer’s instructions. Briefly, intestinal epithelial cells from each sample were mixed with 560 μl of buffer AVL containing carrier RNA and incubated for 10 min at room temperature. After the addition of 560 μl of 100% ethanol, carefully apply the mixed solution to the purification columns. And, the solution passed through purification columns by centrifugation at 6000 × g (8000 rpm). The columns were washed sequentially with 500 μl of buffer AW1 and 500 μl of buffer AW2, and RNA was eluted using 50 μl of RNAse-free water. To test the anti-viral effect of selinexor and suramin, 500 nM selinexor or 1 mM suramin were treated for 24 h before viral infection. The following day, the virus was inoculated onto intestinal epithelial cells for 1 h with occasional rocking at a MOI of 0.001.
Statistics and reproducibility
GraphPad Prism 9.4.1 and Microsoft Excel 2019 were used for data visualisation and analysis. A two-tailed Student’s t-test was used to determine the statistical significance of the data, and the results are presented as the mean ± standard deviation (SD) or mean ± standard error (SEM). The number of samples and independent biological experimental repeats were indicated in the figures or figure legends. Differences between means of the crypt depth from individual groups were determined using Welch’s t-test. The significance is depicted as the P value. The difference of endoscopic scores between individual sample groups was determined using a two-tailed non-parametric Mann–Whitney U test. The survival analysis was performed by the Kaplan–Meier analysis.
Reporting summary
Further information on research design is available in the Nature Portfolio Reporting Summary linked to this article.
- SEO Powered Content & PR Distribution. Get Amplified Today.
- PlatoData.Network Vertical Generative Ai. Empower Yourself. Access Here.
- PlatoAiStream. Web3 Intelligence. Knowledge Amplified. Access Here.
- PlatoESG. Carbon, CleanTech, Energy, Environment, Solar, Waste Management. Access Here.
- PlatoHealth. Biotech and Clinical Trials Intelligence. Access Here.
- Source: https://www.nature.com/articles/s41467-024-45103-7