Time course and visualization of damage
To induce damage and subsequent in-vivo regeneration of the skeletal muscle, we injected CTX into the Tibialis Anterior (TA) muscle of one hind limb of each mouse23,24. Mice injected with CTX were separated into groups differing in the timing of 2H2O labeling relative to the time of initial injury (Fig. 1A). All animals started in the protocol at the same age and time, and were sacrificed on Day 14 after CTX injection. The “Proliferation Stage” group was administered both CTX and 2H2O on the same day (Day 10 after injury) and labeled continuously until sacrifice 4 days post-CTX injection (dpi) to capture the protein flux changes that occurred during initial tissue damage, inflammation-mediated immune response, and activation/proliferation of MuSCs. The “Differentiation Stage” group was injected with CTX on Day 7 after entry, with 2H2O given from 4 to 7 dpi to capture the protein flux changes that occurred in the tissue during MuSCs differentiation into newly formed myofibers and the beginning stages of tissue regeneration. The “Maturation Stage” received a CTX injection on Day 0 and 2H2O from 10 to 14 dpi (Day 10 to Day 14 after injury) to capture the reintegration of new myofibers into existing muscle, as well as the construction of surrounding structures to support newly formed tissue. Control groups (Uninjected) received no CTX injection but were administered 2H2O for 3 days (Day 11 to Day 14 after entry). These time points were selected based on expert opinion and previous literature2,8. Analysis of Hematoxylin & Eosin (H&E) staining of uninjured control tissue at the Proliferation stage (Fig. 1B), Differentiation stage (Fig. 1C), and Maturation stage (Fig. 1D) showed no structural changes to the tissue. The same analysis of the CTX injured tissue at 4 dpi demonstrated widespread myofiber fragmentation and extensive immune cell infiltration at the site of CTX injection (Fig. 1E), which decreased at the beginning stages of newly formed myofibers reintegrating back into unaffected tissue was evident at 7 dpi (Fig. 1F). Visual analysis at 14 dpi shows almost complete regeneration of damaged tissue, which is almost indistinguishable from unaffected tissue (Fig. 1G). Muscle regeneration has been found to be virtually complete after 14 dpi, as previously reported25,26.
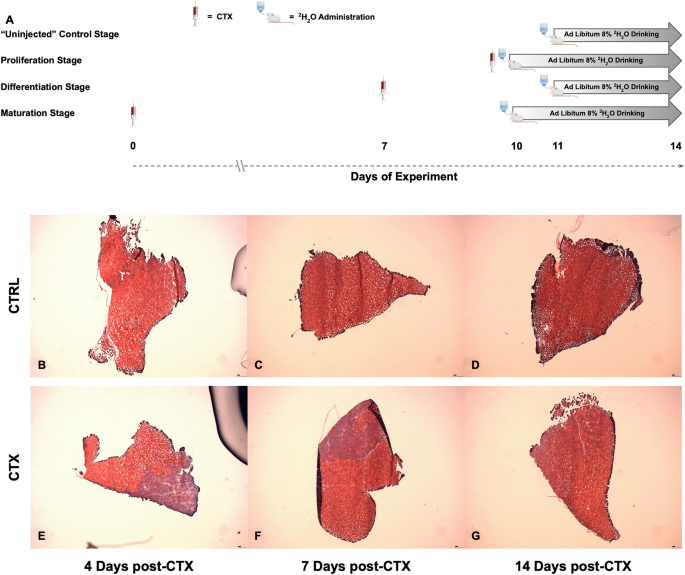
Time course layout and visualization of damage. (A) Overview of 2H2O labeling time course and definition of each stage based on days after CTX injection. Visualization of muscle regeneration from control muscle. (B) 4 days. (C) 7 days. (D) 14 days, and injured tissue. (E) 4 days. (F) 7 days. (G) 14 days after CTX injection. All images taken at ×5 magnification.
DNA turnover (cell proliferation), histologic confirmation of regeneration, and expression of myogenic genes
Histologic quantification was carried out to confirm skeletal muscle regeneration after initial CTX damage. By H&E staining, the quantifiable fraction of damaged tissue decreased significantly (Proliferation Stage: avg. 38%, Differentiation Stage: avg 30%, p < 0.001 from Proliferation Stage; Maturation: no visible signs of damage, Fig. 2B, p < 0.001 from Proliferation Stage, p < 0.001 from Differentiation Stage) as a fraction of the entire tissue cross-sectional area (Fig. 2A). Another visual marker of skeletal muscle regeneration, myofibers with central nuclei, began forming as soon as 4 dpi, in congruence with previous findings (Fig. 2C)26. However, during the Differentiation Stage, the prevalence of central nuclei was significantly higher than the Proliferation Stage (Fig. 2D, p < 0.001), and decreased significantly after the Differentiation Stage transition to the Maturation Stage (Fig. 2D, p < 0.001). Along with visible quantifications of muscle regeneration, we also observed changes in cellular proliferation rates, measured by incorporation rates of 2H into DNA17. To avoid the infiltration of immune cells that proliferate around the damaged tissue in our measurements of 2H incorporation to DNA, single muscle fibers with attached fiber-associated cells were isolated from bulk tissue of all groups by enzymatic digestion and physical separation and then selectively depleted of leukocytes via MACS with CD45+ magnetic beads, as previously described16. The Proliferation Stage showed a high rate of incorporation of 2H in DNA, however, there was a significant drop in cellular proliferation during the Differentiation Stage and Maturation Stage in comparison to the Proliferation Stage (Proliferation Stage: avg. 44%, Differentiation Stage: avg 10%, p < 0.001 from Proliferation Stage; Maturation: avg 3%, p < 0.001 from Proliferation Stage) (Fig. 2E). These results were compared to measurements of gene expression from bulk RNA-seq values for known genes of myogenesis (Fig. 2F)8. At the Proliferation Stage, MyoD, MyoG, and Myf5 all showed significantly increased gene expression values, and MyoD and Myf5 still showed significant increases by the Differentiation Stage. But once the Maturation Stage was reached, there was no significant expression of myogenic genes, and expression of these genes were almost back to control levels. Genes found in bulk RNA-seq data for cell cycling (Ki67, PCNA) were also measured, and interestingly only PCNA during the Differentiation Stage was significant when compared to control (data not shown).
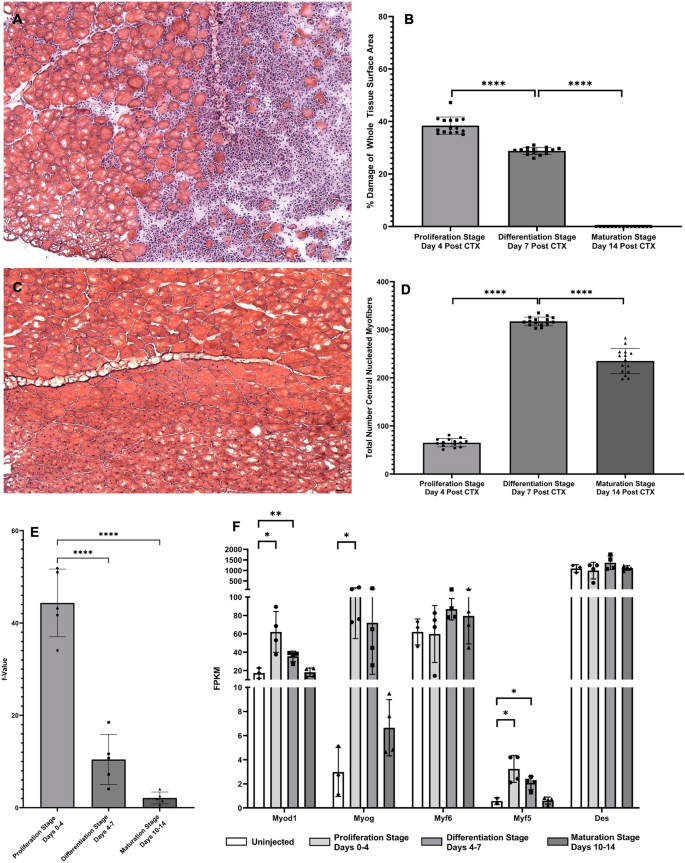
DNA turnover, visual confirmation of regeneration, and gene expression of myogenic genes. (A) Visualization of muscle damage 4 days after CTX injection. Image taken at ×10 magnification. (B) Quantification of damaged muscle tissue as a fraction of whole tissue surface area. Values are expressed as a percentage (%) of damaged tissue area in µM2/whole tissue surface area in µM2. Significance determined by One-Way ANOVA with Benjamini–Hochberg correction for multiple comparisons. *p < 0.05, **p < 0.01, ***p < 0.005, ****p < 0.001. (C) Visualization of central nuclei expression 14 days after CTX injection. Image taken at ×10 magnification. (D) Quantification of individual myofibers expressing central nuclei. Values are expressed as a total number of myofibers with central nuclei per slide. Significance determined by One-Way ANOVA with Benjamini–Hochberg correction for multiple comparisons. *p < 0.05, **p < 0.01, ***p < 0.005, ****p < 0.001. (E) Measuring the fractional replacement rate (f-Value) of DNA with 2H in newly dividing myocytes during various stages of muscle regeneration. Significance was determined by One-Way ANOVA with Benjamini Hochberg correction for multiple comparisons. *p < 0.05, **p < 0.01, ***p < 0.005, ****p < 0.001. (F) Myogenic gene expression in all stages was measured in FPKM and compared to control group. Significance for each individual gene determined by Student’s Unpaired T-Test, *p < 0.05, **p < 0.01, ***p < 0.005, ****p < 0.001.
Flux proteomics
To determine how protein fluxes in skeletal muscle change over time in response to damage, fractional synthesis rates (FSR) of proteins were measured in-vivo by 2H2O administration coupled with HPLC–MS/MS analysis. Since there may be a systemic response to local tissue injury27, we used muscle tissue from a separate mouse that was not injured as a control for most comparisons. As previously stated, we isolated single muscle fibers with attached fiber-associated cells from bulk muscle tissue by enzymatic digestion and physical separation to remove the potential influence of interstitial and other cell types from circulation on our analyses16.
Comparison of global protein turnover rates at each stage
At the end of the Proliferation Stage (4 dpi), the FSR of 73 proteins that passed criteria for kinetic measurements in both the CTX injured and the control limbs were compared. There was no significant global difference in protein FSR values between injured and control muscle tissue during this phase of regeneration (Fig. 3A). At the end of the Differentiation Stage, the FSR of 127 proteins that passed criteria for kinetic measurements in both the CTX injured and the control limbs were compared. Global proteome analysis shows a significant increase in protein FSR values between injured and control muscle tissue, indicating more protein flux response to injury at this stage of regeneration (p < 0.001, Fig. 3B). At the end of the Maturation Stage, the FSR of 125 proteins that passed criteria for kinetic measurements in both the CTX injured and the control limb were compared. Global proteome analysis shows a significant increase in protein FSR values between injured and control muscle tissue during this phase of regeneration (p < 0.001, Fig. 3C). Average FSR values and the standard deviation (SD) for each protein in all the stages can be found in Table 1.
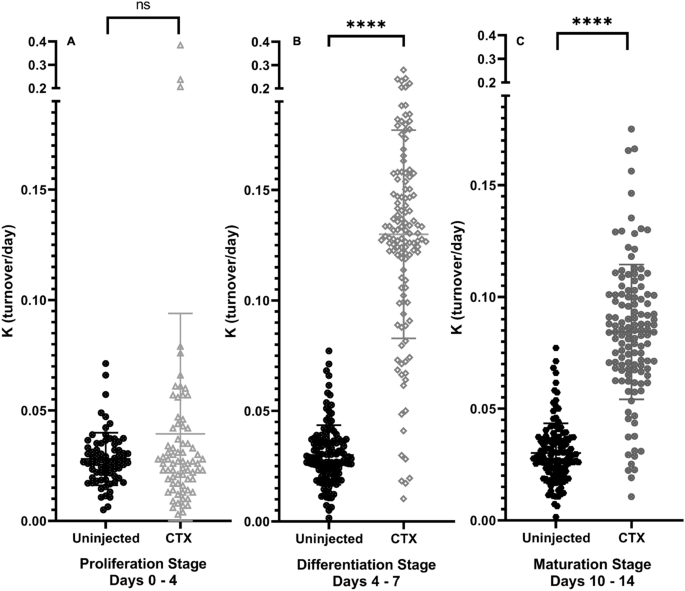
Global protein turnover rates in skeletal muscle at each stage. (A) Overview of global proteome FSR changes between CTX and control muscle tissue after 4 days of CTX injection. (B) Overview of global proteome FSR changes between CTX and control muscle tissue after 7 days of CTX injection. (C) Overview of global proteome FSR changes between CTX and control muscle tissue after 14 days of CTX injection. For all figures, significance determined by Student’s Unpaired T-Test, *p < 0.05, **p < 0.01, ***p < 0.005, ****p < 0.001.
Changes in protein ontology group turnover rates in each stage
Functional clusters of protein groups were analyzed by gene ontology enrichment using DAVID software from NIH to determine which cellular processes were highly affected at each stage (Fig. 4A–C). In the Proliferation Stage, only the Myofibril cluster had a significant number of proteins with higher FSR values in the injured limb compared to control limb (13/18 increased, p < 0.05). Other functional clusters [Cytoplasm (9/15 increased, p > 0.05), Glycolysis (5/10 increased, p > 0.05), Mitochondria (7/10 decreased, p > 0.05), and Oxidative Phosphorylation (7/12 decreased, p > 0.05)] were not significantly affected in this stage. In the Differentiation Stage, all measured functional clusters [Cytoplasm (24/25 increased, p < 0.05), Myofibril (19/19 increased, p < 0.05), Glycolysis (12/12 increased, p < 0.05), Mitochondria (24/25 increased, p < 0.05), and Oxidative Phosphorylation (35/35 increased, p < 0.05)] had a significant increase in the number of proteins with a higher FSR value in the injured limb compared to control limb (Fig. 4B). In the Maturation Stage, all measured functional cluster protein groups [Cytoplasm (22/23 increased, p < 0.05), Myofibril (17/19 increased, p < 0.05), Glycolysis (12/12 increased, p < 0.05), Mitochondria (23/23 increased, p < 0.05), and Oxidative Phosphorylation (38/39 increased, p < 0.05)] showed significant increases in the number of proteins with a higher FSR value in the injured limb compared to control limb (Fig. 4C).
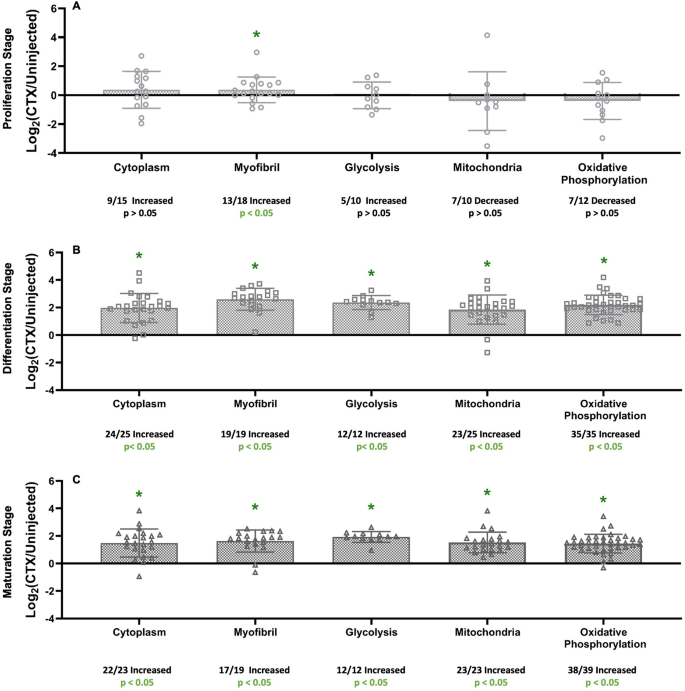
Changes in protein group turnover rates in each stage. (A) Protein Group analysis of proteins found during the Proliferation Stage (4 dpi) and separated into ontologies based on NIH DAVID analysis. (B) Protein Group analysis of proteins found during the Differentiation Stage (7 dpi) and separated into ontologies based on NIH DAVID analysis. (C) Protein Group analysis of proteins found during the Maturation Stage (14 dpi) and separated into ontologies based on NIH DAVID analysis. Significance determined by Binomial Test of the proportion of proteins showing a higher or lower value of FSR in relation to uninjected (control), *p < 0.05.
Individual protein turnover rates at each stage
In the Proliferation Stage, 8 individual proteins stood out as statistically significant after correction for multiple comparisons between CTX injected and control muscle (Fig. 5A). Proteins from skeletal muscle that have been previously identified as systemic markers of whole muscle FSR values (CA3)28, proteins involved in accessing cellular components to DNA to either promote or silence the DNA replication processes (Histone H2B Type 1-M)29, and individual glycolytic enzymes, like TPI, showed a significant change in FSR during this stage of regeneration. In the Differentiation Stage, 14 individual proteins were significant after correction for multiple comparisons that include different Myosin Heavy Chain isoforms including Myosin 3, also known as Embryonic Myosin Heavy Chain (EmyHC) and Myosin Light Chain 1/330,31,32. A few more glycolytic enzymes than just TPI (Phosphoglycerate Mutase 2 (PGM-2), Glyceraldehyde-3-dehydrogenase (G3PDH), & Lactate Dehydrogenase A (LDH-A)) had significantly increased FSR values during this stage of regeneration as well (Fig. 5B). In the Maturation Stage, 91 individual proteins stood out as having significantly different FSR values in the injured limb compared to control limb after correction for multiple comparisons (Fig. 5C). Previously mentioned individual proteins of interest, (CA3, as well as Creatine Kinase-Muscle isoform (CK-M), and Myosin Light Chain 1/3) had significantly higher protein turnover at this stage of regeneration as well28. Interestingly, Myosin 3 also had a significantly higher FSR in the injured muscle at this time point, after nascent myofibers began to mature31. Also, Histone H2B Type 1-M is seen to have a significant increase in this stage as well. All measured glycolysis proteins, including the ones mentioned above (TPI, PGM-2, G3PDH, LDH-A), were significantly increased as well.
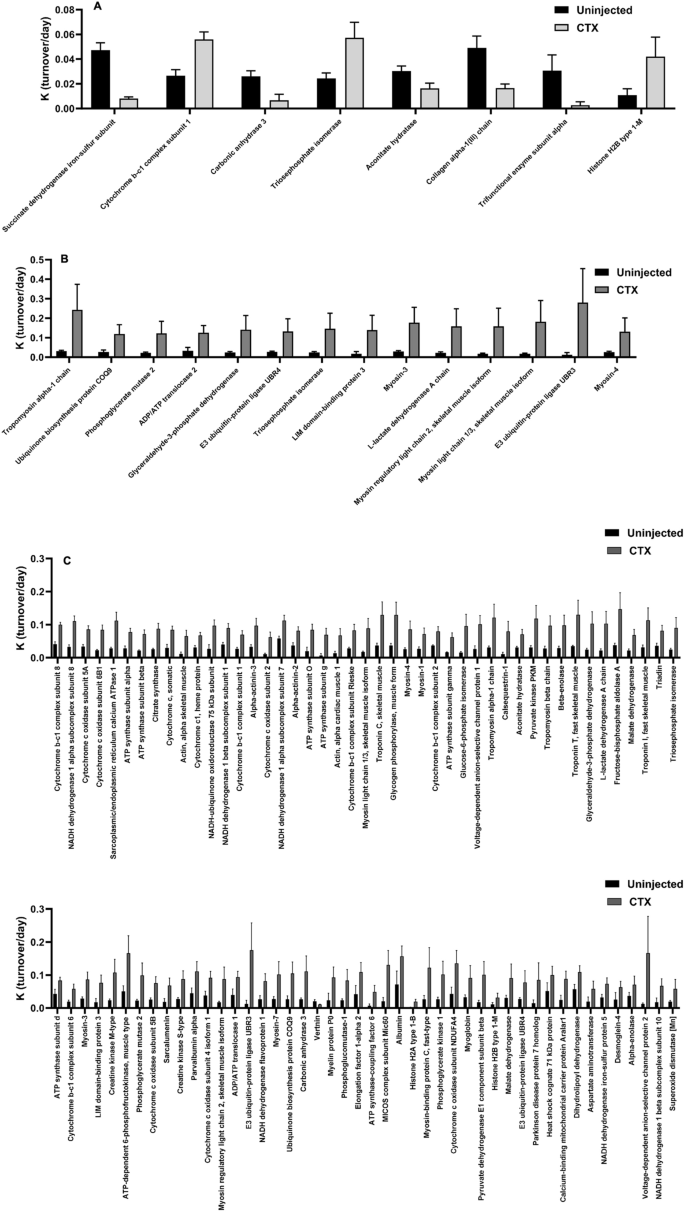
Significantly different individual protein turnover rates at each stage. (A) Comparison of change in individual protein FSR value between CTX injected and control limbs for proteins that are significantly different after Benjamini Hochberg correction for multiple comparisons at 4 days after CTX injection (Proliferation Stage). (B) Comparison of change in individual protein FSR value between CTX injected and control limbs for proteins that are significantly different after Benjamini Hochberg correction for multiple comparisons at 7 days after CTX injection (Differentiation Stage). (C) Comparison of change in individual protein FSR value between CTX injected and control limbs for proteins that are significantly different after Benjamini Hochberg correction for multiple comparisons at 14 days after CTX injection (Maturation Stage). Significance determined by Student’s Unpaired T-Test with Benjamini Hochberg correction for multiple comparisons, *p < 0.05, **p < 0.01, ***p < 0.005, ****p < 0.001.
Global gene expression changes at each stage
Gene expression values were normalized to fragment per kilobase millions (FPKM) values, which were used to compare global gene expression profiles of each stage of muscle regeneration. In the Proliferation Stage, 17,198 individual gene expression values were measured. Of those 17,198 genes, 2555 genes (14.9%) were significantly upregulated, 2423 genes (14.1%) were significantly downregulated, and 12,220 (71.0%) genes did not change significantly (-Log10(p) > 1.301, Fig. 6A). In the Differentiation Stage, 16,940 individual gene expression values were measured. Of those 16,940 genes, 2397 genes (14.2%) were significantly upregulated, 2362 genes (13.9%) were significantly downregulated, and 12,181 genes (71.9%) did not change significantly (−Log10(p) > 1.301, Fig. 6B). In the Maturation Stage, 16,474 individual gene expression values were measured. Of those 16,474 genes, 778 genes (4.7%) were significantly upregulated, 771 genes (4.7%) were significantly downregulated, and 14,925 genes (90.6%) did not change significantly (−Log10(p) > 1.301, Fig. 6C). Up to the Top 50 Gene Ontology Biological Processes (GOBP’s) were measured from the list of genes that were either significantly upregulated or downregulated in each stage and can be viewed in the Supplemental Data (Figs. S1–S3).
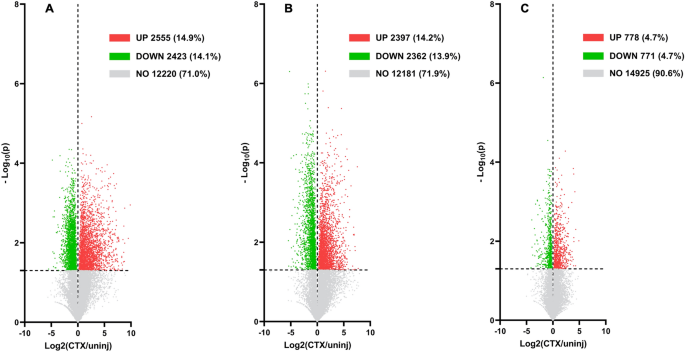
Global gene expression rates at each stage. (A) Volcano plot of global gene expression (FPKM) on the X-axis and Log10(p value) on the Y-axis for all genes found during the Proliferation Stage (4 dpi). (B) Volcano plot of global gene expression (FPKM) on the X-axis and Log10(p value) on the Y-axis for all genes found during the Differentiation Stage (7 dpi). (C) Volcano plot of global gene expression (FPKM) on the X-axis and Log10(p value) on the Y-axis for all genes found during the Maturation Stage (14 dpi). All values with a -log10(p value) of below 1.301 were non-significant and are colored gray.
Group ontology gene expression at each stage for matched proteins
UniProt unique protein identification numbers (Accession #) were used to find Gene IDs for all proteins that were measured in functional cluster protein groups from DAVID by NIH software. FPKM values for each of those individual genes identified were ratioed to generate a Log2(Fold Change) to measure the magnitude of change between each stage of muscle regeneration and control tissue. These values were then split up into the same functional cluster protein groups, as seen in Fig. 4. In the Proliferation Stage, all of the functional clusters that were measured had a significant number of proteins with lower FSR values in the injured limb compared to control limb [Myofibril (15/18 decreased, p < 0.05), Glycolysis (9/10 decreased, p < 0.05), Mitochondria (8/9 decreased, p < 0.05), and Oxidative Phosphorylation (12/12 decreased, p < 0.05)], except for Cytoplasm (9/14 decreased, p > 0.05) (Fig. 7A). In the Differentiation Stage, again most of the functional clusters that were measured had a significant number of proteins with lower FSR values in the injured limb compared to control limb [Cytoplasm (16/23 decreased, p < 0.05), Glycolysis (10/12 decreased, p < 0.05), Mitochondria (23/24 decreased, p < 0.05), and Oxidative Phosphorylation (33/37 decreased, p < 0.05)], except for Myofibril (10/19 decreased, p > 0.05), (Fig. 7B). In the Maturation Stage, 3 of the measured functional cluster protein groups [Myofibril (13/18 increased, p < 0.05), Glycolysis (11/12 increased, p < 0.05), Oxidative Phosphorylation (34/39 increased, p < 0.05)] saw significant increases in the number of proteins with a higher FSR value in the injured limb compared to control limb, while 2 did not [Cytoplasm (13/21 increased, p > 0.05), Mitochondria (11/22 decreased, p > 0.05)] (Fig. 7C).
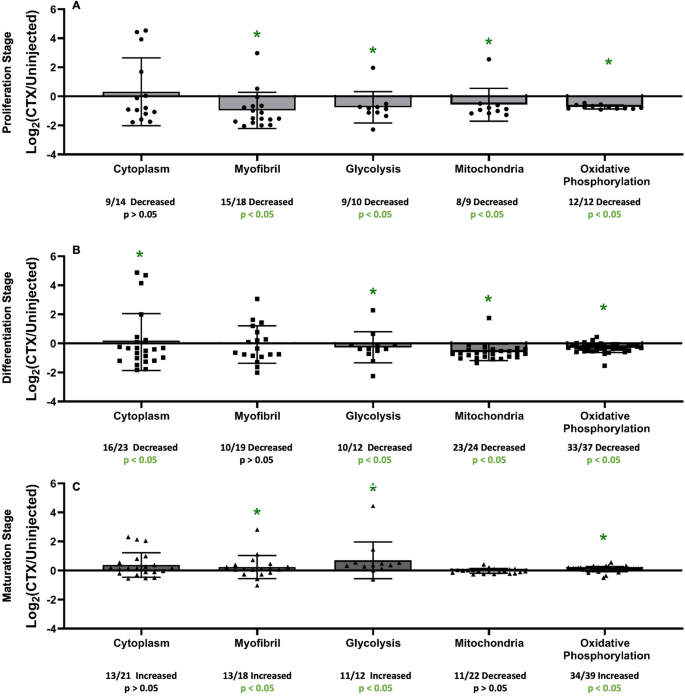
Gene expression at each stage for matched individual proteins in group ontologies. (A) Functional Clusters of gene expression based on protein groups (used in Fig. 4) from NIH DAVID software at the Proliferation Stage (4 dpi). (B) Functional Clusters of gene expression based on protein groups (used in Fig. 4) from NIH DAVID software at the Differentiation Stage (7 dpi). (C) Functional Clusters of gene expression based on protein groups (used in Fig. 4) from NIH DAVID software at the Maturation Stage (14 dpi). For all groups, significance is determined by Binomial Test of the proportion of proteins showing a higher or lower value of FSR in relation to control, *p < 0.05.
Correlations of changes in gene expression to changes in protein FSR
To correlate changes in gene expression FPKM values with their protein FSR values, a 2-dimensional graph was created to plot the Log2FC of FPKM values on the Y axis and Log2FC of protein FSR values on the X axis for each stage of muscle regeneration. In the Proliferation Stage, there is no significant correlation between the magnitude of change in FPKM and FSR values (R2 = 0.01819, p > 0.05, Fig. 8A). In the Differentiation Stage, there is also no significant correlation between the magnitude of change in FPKM and FSR values (R2 = 0.00184, p > 0.05, Fig. 8B). In the Maturation Stage as well, there is no significant correlation between the magnitude of change in FPKM and FSR values (R2 = 0.00220, p > 0.05, Fig. 8C). These results indicate that there is no significant correlation between the magnitude of change in gene expression values and the magnitude of change in protein turnover at any of the stages of muscle regeneration.
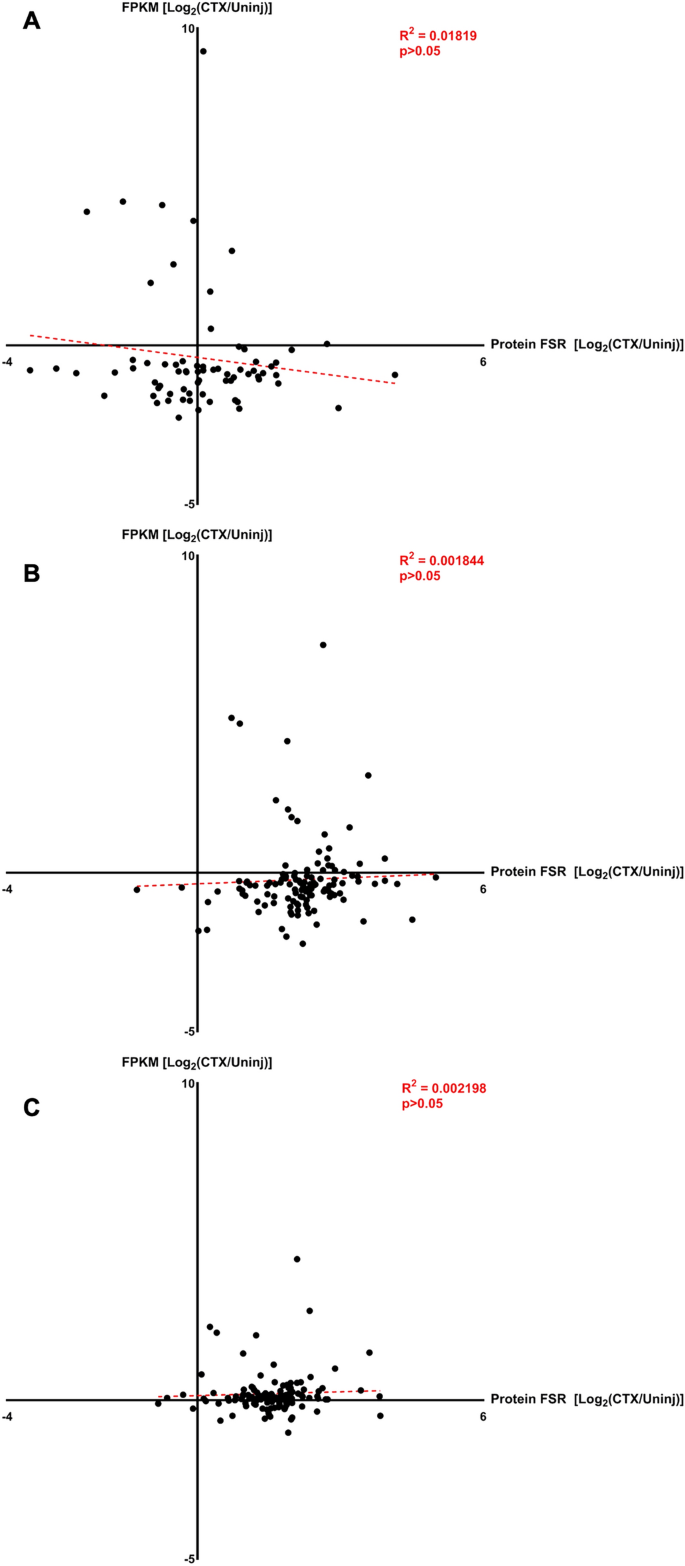
Correlation of gene expression to protein FSR. (A) Correlation graphs between log transformed fold change in gene expression (FPKM, Y Axis) and log transformed fold change in protein turnover (FSR, X Axis) for Proliferation Stage (4 dpi). (B) Correlation graphs between log transformed fold change in gene expression (FPKM, Y Axis) and log transformed fold change in protein turnover (FSR, X Axis) for Differentiation Stage (7 dpi). (C) Correlation graphs between log transformed fold change in gene expression (FPKM, Y Axis) and log transformed fold change in protein turnover (FSR, X Axis) for Maturation Stage (14 dpi). For all graphs, significance was determined by simple linear regression equation with R2 value shown.
Myh3 gene expression, EmyHC protein abundance, EmyHC protein levels, and My3 protein turnover
To support our analysis of protein flux changes, we incorporated static abundance measurements of certain proteins that are only transiently expressed during muscle regeneration, along with our genome data, to confirm which stage of new myofiber genesis we are exploring. EmyHC protein expression was analyzed by immunofluorescence intensity on muscle sections that were taken at the end of each regeneration stage (Fig. 9A). The Proliferation Stage showed modest EmyHC expression, however, a significant increase in EmyHC expression was seen between the Proliferation Stage and the Differentiation Stage (Fig. 9B, p < 0.001). By the end of the Maturation Stage, the level of EmyHC expression was significantly lower than both the Proliferation Stage (Fig. 9B, p < 0.001) and the Differentiation Stage (Fig. 9B, p < 0.001), as most myofibers had undergone their initial formation stages and began to mature back into unaffected tissue. Protein levels of EmyHC were also measured from the fluorescent images and followed a similar pattern of significance as the abundance measurements expect for no significant difference between Proliferation and Differentiation Stages (Fig. 9B). Myh3, the gene for EmyHC, expression was also measured at the Proliferation Stage, and showed a significant increase in comparison to control values (Fig. 9C, p < 0.005). However, Myh3 gene expression no longer showed a significant difference from control levels at the Differentiation Stage and was significantly reduced from the Proliferation Stage (p < 0.005). These gene expression levels of Myh3 were also observed in the Maturation Stage, with levels that were like the control group and significantly lower than the Proliferation Stage (Fig. 9C, p < 0.001).
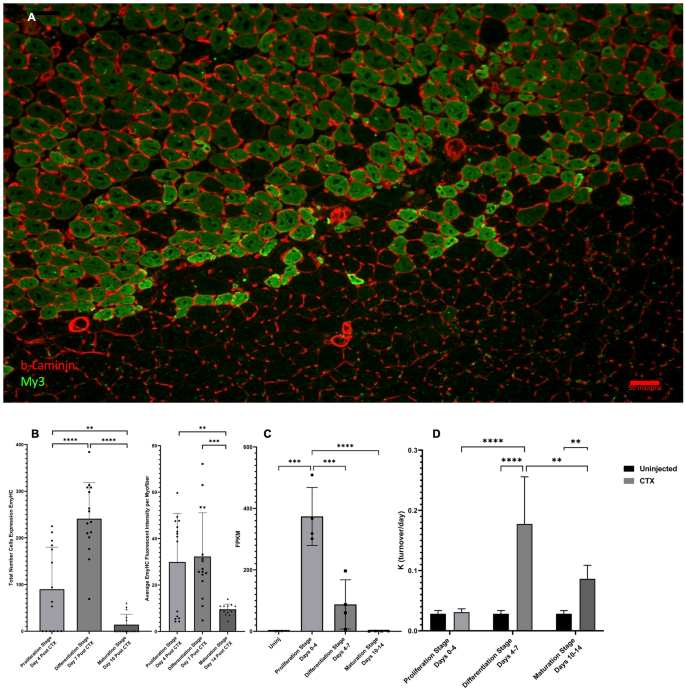
Myh3 gene expression, EmyHC protein abundance, and My3 protein turnover. (A) Visualization of EmyHC (green) expression, counterstained with β-Laminin (red), at 7 days post CTX injection (Differentiation Stage). (B) Quantification of individual myofibers expressing Embryonic Myosin Heavy Chain (EmyHC). Values are expressed as: number of myofibers/100 µM2 of tissue. Average measurement of protein levels by fluorescent staining intensity of individual myofibers at each stage. Significance for both graphs was determined by One-Way ANOVA with Benjamini–Hochberg correction for multiple comparisons. *p < 0.05, **p < 0.01, ***p < 0.005, ****p < 0.001. (C) Gene expression (FPKM) of Myh3 during various stages of muscle regeneration. Significance determined by One-Way ANOVA with Benjamini–Hochberg correction for multiple comparisons. *p < 0.05, **p < 0.01, ***p < 0.005, ****p < 0.001. (D) Myosin 3 (EmyHC) turnover per day (K) value during various stages of muscle regeneration. Significance determined by One-Way ANOVA with Benjamini–Hochberg correction for multiple comparisons. *p < 0.05, **p < 0.01, ***p < 0.005, ****p < 0.001.
In addition, we investigated the relationship between kinetic measurements, protein abundance measurements, and gene expression values for this protein during the process of muscle regeneration. EmyHC FSR did not show a significant increase from control during the Proliferation Stage (Fig. 9D, p > 0.05), when protein abundance level measurements were only moderately increased (Fig. 9B) and Myh3 gene expression levels were significantly increased (Fig. 9C, p < 0.001). However, as with EmyHC abundance measurements, there was a significant increase in the EmyHC FSR value in the injured limb during the Differentiation Stage in comparison to the injured limb of the Proliferation Stage, as well as the control limb in the Differentiation Stage (Fig. 9D, p < 0.001). However, at this stage Myh3 gene expression was significantly decreased from the Proliferation Stage (Fig. 9C, p < 0.005). In the Maturation Stage, there was a significant decrease in EmyHC FSR from the injured limb of the Differentiation Stage to the injured limb of the Maturation Stage (p < 0.01). The same significant decrease between the two stages can be seen with both measurements of EmyHC protein abundance (number and staining intensity, Fig. 9B, p < 0.001). Myh3 gene expression was also significantly lower from previous stages (Proliferation Stage) and not significantly different from the control group. Interestingly, EmyHC from the injured limb during the Maturation Stage was still significantly higher in FSR values than control. This is different from what is seen in EmyHC protein abundance during the Maturation Stage, as it was the lowest of all the stages we measured. Also, there is no significant difference between the EmyHC FSR values of the injured limb from the Proliferation Stage and the injured limb from the Maturation Stage, which is different from what is seen in both EmyHC abundance and protein levels (Fig. 9B).
TTN gene expression, titin protein turnover, and correlation between the two measurements
To demonstrate the discordance between gene expression and protein turnover during muscle regeneration, we investigated the individual relationship of Titin (TTN) gene expression and protein turnover at various stages (Fig. 10A,B). Gene expression values of TTN show significant decreases at the Proliferation and Differentiation stages, with expression levels almost returning to normal by the Maturation Stage and being non-significant (Fig. 10A). However, this was not the case with Titin protein turnover, as there was no significant change between the individual protein’s turnover values at any stage of regeneration and the control groups (Fig. 10B). This general lack of correlation between gene expression and protein turnover is demonstrated well when the magnitude of change in both of these values are plotted together on a correlation graph (Fig. 10C).
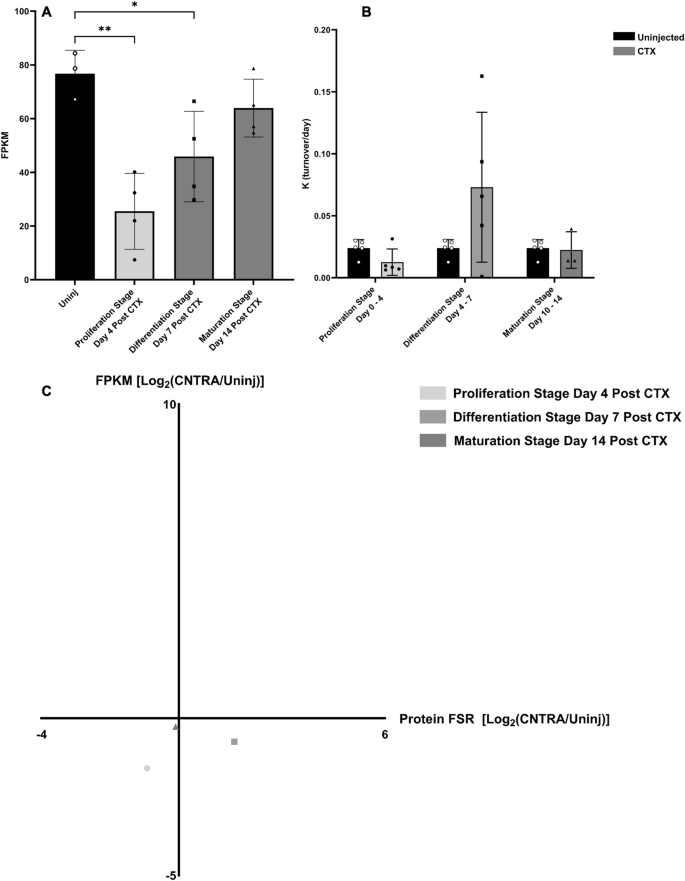
TTN gene expression and titin protein turnover. (A) Gene expression (FPKM) of TTN during various stages of muscle regeneration. Significance determined by One-Way ANOVA with Benjamini–Hochberg correction for multiple comparisons. *p < 0.05, **p < 0.01, ***p < 0.005, ****p < 0.001. (B) Titin protein turnover per day (K) value during various stages of muscle regeneration. Significance determined by One-Way ANOVA with Benjamini–Hochberg correction for multiple comparisons. *p < 0.05, **p < 0.01, ***p < 0.005, ****p < 0.001. (C) Correlation graph between log-transformed fold change in gene expression (FPKM, Y Axis) and log-transformed fold change in protein turnover (FSR, X Axis) for various stages of regeneration of the TTN gene to Titin protein.
- SEO Powered Content & PR Distribution. Get Amplified Today.
- PlatoData.Network Vertical Generative Ai. Empower Yourself. Access Here.
- PlatoAiStream. Web3 Intelligence. Knowledge Amplified. Access Here.
- PlatoESG. Carbon, CleanTech, Energy, Environment, Solar, Waste Management. Access Here.
- PlatoHealth. Biotech and Clinical Trials Intelligence. Access Here.
- Source: https://www.nature.com/articles/s41598-024-62115-x