ARID1B plays an essential role in regulating adult mouse incisor growth and tissue homeostasis
To investigate the role of ARID1B in regulating MSC fate commitment and mesenchymal tissue homeostasis, we evaluated the expression pattern of ARID1B in the proximal region of the mouse incisor. We found that ARID1B is widely expressed in the dental mesenchyme near the NVB where MSCs reside, as well as in odontoblasts, dental pulp cells, and epithelial cells, but less in the TAC region and pre-odontoblasts (Fig. 1a, b). Previous study has shown that GLI1+ cells are MSCs surrounding the NVB19. To find out whether ARID1B is expressed in these GLI1+ MSCs, we co-stained GLI1 and ARID1B and found that ARID1B+ cells in the NVB region overlap with a sub-population of GLI1+ cells (Fig. 1c, d). Thus, we hypothesized that ARID1B plays a role in regulating MSC commitment and tissue homeostasis in the adult mouse incisor.
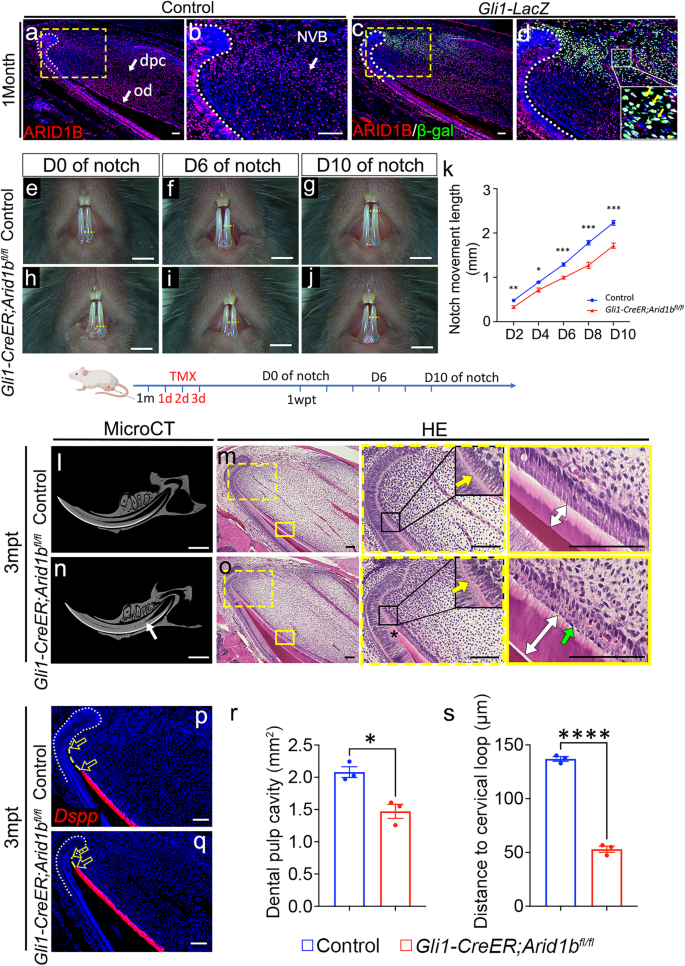
a–d Immunostaining of ARID1B (red) in control (a, b) mouse incisor and co-immunostaining of ARID1B (red)/β-galactosidase (β-gal) (green) in Gli1-LacZ mouse incisor (c, d). b, d represent the high-magnification image of the box in (a, c). White dotted lines outline the cervical loop. White arrows indicate ARID1B+ cells. Yellow arrows indicate the ARID1B+/GLI1+ cells. e–j Notch movement assay in control (e–g) and Gli1-CreER;Arid1bfl/fl (h–j) mice. Yellow dotted lines show the notch position. Blue lines show the gingival margin. TMX, tamoxifen; wpt, week post-tamoxifen injection. Illustration below (e–k) created with BioRender.com released under a Creative Commons Attribution-NonCommercial-NoDerivs 4.0 Internatioanl license. k Quantification of the notch movement every other day from D2 to D10. Data are mean ± SEM, control n = 5, Gli1-CreER;Arid1bfl/fl n = 7, unpaired two-tailed Student’s t-test. D2, p = 0.0083; D4, p = 0.0103; D6, p = 0.0001; D8, p = 0.0003; D10, p = 0.0001. l–o MicroCT and HE staining of control (l, m) and Gli1-CreER;Arid1bfl/fl (n, o) mouse incisors at 3 months after tamoxifen induction. l, n MicroCT of control (l) and Gli1-CreER;Arid1bfl/fl (n) mouse incisors. White arrow indicates the narrowed dental pulp. m, o HE staining of control (m) and Gli1-CreER;Arid1bfl/fl (o) mouse incisors. Yellow arrows indicate the initiation of odontoblast polarization. Green arrow indicates the disordered alignment of odontoblasts. White two-way arrows indicate the dentin thickness. Black asterisk indicates stacked and distorted dentin. Boxes in m and o are shown at higher magnification on the right. p, q Dspp (red) in situ hybridization in control (p) and Gli1-CreER;Arid1bfl/fl (q) mouse incisors. White dotted lines outline the cervical loop. Yellow dotted lines show the cervical loop bending point to the odontoblast initiation distance. Unfilled arrows indicate the distance between the yellow dotted lines. n = 3. r Quantification of the dental pulp cavity. Data are mean ± SEM, n = 3, unpaired two-tailed Student’s t-test. p = 0.0113. s Quantification of the distance of Dspp+ cells to the cervical loop. Data are mean ± SEM, n = 3, unpaired two-tailed Student’s t-test. p < 0.0001. Source data are provided as a Source Data file. Scale bars: 2 mm (e–j, l, n); 100 μm (other images).
GLI1+ MSCs located surrounding the NVB support the mouse incisor’s growth and replenishment throughout the lifespan. Using the Gli1-CreER line, we generated Gli1-CreER;Arid1bfl/fl mice, in which Arid1b was inactivated in the GLI1+ lineage after tamoxifen induction at one month of age, and confirmed that Arid1b was effectively deleted from the incisor mesenchymal and epithelial cells (Supplementary Fig. 1a–d). To evaluate the impact of the loss of Arid1b in MSCs on the mouse incisor growth, we first performed an incisor growth assay by comparing the movement of a notch made in the incisor enamel above the gingival margin in both control and Arid1b mutant mice. We found that the growth rate was significantly slower in Arid1b mutant mice than in the control across all measurement time points (Fig. 1e–k). This result indicated that the loss of Arid1b in the GLI1+ lineage impairs the adult mouse incisor growth.
Next, we assessed the long-term impact following the loss of Arid1b. At 2 months post-tamoxifen induction, the dental pulp cavity was narrower in Gli1-CreER;Arid1bfl/fl mice than in the control, as shown by microCT (Supplementary Fig. 1e, h). Histologically, the polarization of odontoblasts (Supplementary Fig. 1f, i) and the expression of odontoblast differentiation marker Dspp (Supplementary Fig. 1g, j) were initiated more proximally to the cervical loop in Arid1b mutant mice than in the control mice. The cervical loop also appeared to be smaller in the Arid1b mutant mice. The odontoblast alignment was affected, and the dentin appeared thicker in the Arid1b mutant mice. Moreover, the phenotype of the Arid1b mutant mice became more severe at 3 months post-tamoxifen induction, with a limited dental pulp cavity and stacked dentin at the proximal end of the incisor (Fig. 1l–o, r). The odontoblasts were well aligned, and their differentiation was marked by the organized alignment of nuclei along the basement membrane in the control; in contrast, the organization of the odontoblasts was abnormal, and the nuclei were in the opposite position in Arid1b mutant mice. The odontoblasts were premature in the proximal region in the Arid1b mutant mice, as confirmed by Dspp marker staining (Fig. 1p, q, s). These results indicated that ARID1B plays a role in maintaining adult mouse incisor tissue homeostasis.
Furthermore, to investigate the cellular changes underlying the reduced growth rate and abnormal dentin formation in Arid1b mutant incisors, we evaluated the potential of TACs to differentiate into odontoblasts after the loss of Arid1b. We labeled TACs in the DNA synthesis phase using EdU injection and harvested the tissue 48 h later to assess the TAC differentiation. The overlap between Dspp+ odontoblasts and EdU-labeled cells represented the TAC differentiation ability, and the overlap length indicated the migration rate of these differentiated cells during the preceding 48 h. We observed a reduced overlap length of EdU+/Dspp+ cells in Arid1b mutant mice compared to controls at 1 week post-induction, indicating that loss of Arid1b caused the compromised migration rate of the differentiated TACs (Supplementary Fig. 1k–n, q). To understand the cause of abnormal dentin formation, we administered calcein and alizarin red S dual fluorescence injections at different time points to dynamically compare the odontoblast migration rate and dentin deposition rate. Using this approach, the fluorescence precipitation represents dentin formation at the time of injection. We compared the odontoblast migration length and dentin deposition depth over a period of 5 days. Statistical analysis revealed a significantly shorter odontoblast migration length in Arid1b mutant mice compared to controls, while there was no significant difference in the depth of dentin deposition (Supplementary Fig. 1o–p, r). These findings indicated that the loss of Arid1b impairs the odontoblast migration rate, leading to abnormal stacked dentin.
GLI1+ cells contribute to the mesenchymal and epithelial lineages in the mouse incisor19 and ARID1B was effectively deleted in both tissues in the Gli1-CreER;Arid1bfl/fl mice. To clarify whether the loss of Arid1b in the dental epithelium has any effect on incisor tissue homeostasis, we used the Sox2-CreER line to specifically delete Arid1b in the epithelial lineage by generating Sox2-CreER;Arid1bfl/fl mice. Again, we induced Cre activity with tamoxifen at 1 month of age and harvested the incisor at 2 months post-induction. There were no signs of either premature odontoblasts or a differentiation defect in Sox2-CreER;Arid1bfl/fl mice as compared to the control (Supplementary Fig. 2a–f). This result indicated that the loss of Arid1b specifically in the dental mesenchyme impairs the incisor growth and tissue homeostasis.
Loss of Arid1b disturbs MSCs’ quiescence and leads to their proliferation
The continuous growth of the mouse incisor is induced by the progression of MSCs giving rise to TACs, along with proliferation and differentiation in the proximal region. Due to the overlap between ARID1B+ cells and a subpopulation of GLI1+ cells in the proximal region, we investigated the potential impact of Arid1b loss on GLI1+ MSCs. We generated Gli1-CreER;Arid1bfl/fl;Gli1-LacZ mice to compare the numbers of GLI1+ cells in the incisors of these mutants and Gli1-LacZ control mice. At 5 days post-induction, the number of GLI1+ cells was significantly reduced in the Gli1-CreER;Arid1bfl/fl;Gli1-LacZ mice compared to Gli1-LacZ mice (Fig. 2a–e). These MSCs are quiescent cells that undergo slow-cycling self-renewal and reside in the proximal region of the mouse incisor. Thus, we investigated the impact of ARID1B on MSCs’ quiescence based on their label-retaining ability. Since incisor mesenchyme turnover takes about 1 month19, we injected control and Gli1-CreER;Arid1bfl/fl mice with EdU for a 1-month period beginning from postnatal day 5 and analyzed the cells after another month. In this case, the label retaining cells (LRCs) detected by EdU staining would be the quiescent cells. We found the number of LRCs was significantly reduced in Gli1-CreER;Arid1bfl/fl mice compared to controls (Fig. 2f–j), confirming that loss of Arid1b impairs mouse incisor MSC quiescence.
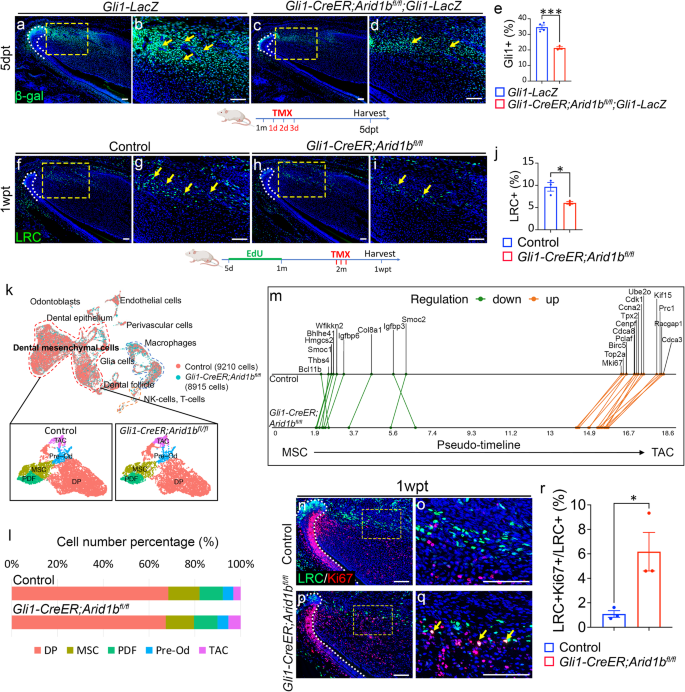
a–d Immunostaining of β-gal (green) in Gli1-LacZ and Gli1-CreER;Arid1bfl/fl;Gli1-LacZ mouse incisors. b, d represent the high-magnification images of the boxes in (a, c). White dotted lines outline the cervical loop. Yellow arrows point to the positive cells. dpt, day post-tamoxifen injection. e Quantification of GLI1+ cells in dental mesenchyme. Data are mean ± SEM, Gli1-LacZ n = 4, Gli1-CreER;Arid1bfl/fl;Gli1-LacZ n = 3, unpaired two-tailed Student’s t-test. p = 0.0007. f–i EdU staining of the LRCs (green) of incisors from control (f, g) and Gli1-CreER;Arid1bfl/fl (h, i). g, i represent the high-magnification images of the boxes in (f, h). White dotted lines outline the cervical loop. Yellow arrows point to the positive cells. Schematics of tamoxifen induction and EdU labeling protocol under (a–d, f–i), created with BioRender.com released under a Creative Commons Attribution-NonCommercial-NoDerivs 4.0 Internatioanl license. j Quantification of LRCs in dental mesenchyme. Data are mean ± SEM, n = 3, unpaired two-tailed Student’s t-test. p = 0.0238. k UMAP visualization of integrated scRNA-seq and the subclusters in dental mesenchymal cells from control and Gli1-CreER;Arid1bfl/fl mouse incisors. MSC, mesenchymal stem cell; PDF, proximal dental follicle; TAC, transit-amplifying cell; DP, dental pulp; Pre-Od, pre-odontoblast. l Cell number percentage of dental mesenchymal cell clusters in control and Gli1-CreER;Arid1bfl/fl samples based on scRNA-seq data. m GeneSwitches comparison of pseudotime along the MSC to TAC trajectory between control and Gli1-CreER;Arid1bfl/fl mouse incisor samples. Green dots indicate the pseudo-timepoints of genes that have been switched off, while orange dots indicate the genes that have been switched on. The green and orange lines connect the same genes. n–q Co-immunostaining of LRCs (green) and Ki67 (red) in control (n, o) and Gli1-CreER;Arid1bfl/fl (p, q) mouse incisors. o, q represent high-magnification images of boxes in (n, p). White dotted lines outline the cervical loop. Yellow arrows point to the co-stained positive cells. r Quantification of the percentage of LRC+/Ki67+ cell number in LRC+ cells from control and Gli1-CreER;Arid1bfl/fl mouse incisors. Data are mean ± SEM, n = 3, unpaired two-tailed Student’s t-test. p = 0.0333. Source data are provided as a Source Data file. Scale bars: 100 μm.
To understand the reason for the reduction in GLI1+ MSCs following the loss of Arid1b, we first conducted TUNEL assay to compare apoptosis levels between control and Arid1b mutant mice. The results showed that there was no obvious increase in apoptosis at 5 days post-induction, suggesting that the decrease in MSCs was not caused by an increase in cell death (Supplementary Fig. 2g–j). To further investigate the underlying causes for MSC changes, we performed single-cell RNA sequencing (scRNA-seq) on the proximal incisor tissue from both control and Gli1-CreER;Arid1bfl/fl mice 4 days post-tamoxifen induction. We integrated the scRNA-seq data from the control (9210 cells) and Gli1-CreER;Arid1bfl/fl (8915 cells) mice, and identified a large group of dental mesenchymal cells along with other cell types via unsupervised clustering and marker analysis (Supplementary Fig. 3a, b). We then focused on the dental mesenchymal cells and subclustered them into five distinct populations (Fig. 2k). We identified the specific markers for each cluster and validated their expression patterns in the mouse incisor (Supplementary Fig. 3c–e). To investigate the effects of Arid1b loss at the single-cell level across different cell clusters, we compared the relative percentage of cells in each cluster between control and Arid1b mutant samples. We observed a decrease in the number of MSCs in the Arid1b mutant sample, consistent with the in vivo marker analysis, alongside an increase in the TAC number (Fig. 2l). The comparison at the single-cell level suggested that the loss of Arid1b may impact MSC quiescence by inducing MSC proliferation.
To validate our hypothesis, we utilized scRNA-seq data to construct a computational model of change across time between control and Arid1b mutant mouse incisor mesenchymal cells using Monocle3 pseudotime analysis (Supplementary fig. 4a, b). This model confirmed the sequence of cell differentiation, showing that MSCs are the earliest (least differentiated) cells, followed by TACs and dental pulp cells, which are later and more differentiated cells. This data aligns with the in vivo dental mesenchymal cell differentiation axis. To gain further insights into the stem cell fate transition of dental mesenchymal cells, we conducted GeneSwitches analysis to identify the order of genes that are activated or repressed in the specific lineages30. We acquired sets of genes that switched on/off along the MSC to TAC trajectory in both control and Arid1b mutant samples (Supplementary Fig. 4c, d). This analysis helped us identify cluster-specific markers, such as Igfbp6 for MSCs and Pclaf for TACs, which we compared between control and Arid1b mutant samples (Supplementary Fig. 4e, f). Furthermore, we visualized and compared the patterns of common markers switching on/off along the MSC-TAC pseudotime trajectory between control and Arid1b mutant samples. Interestingly, the majority of switched-off genes displayed slightly earlier pseudo-timepoints in the Arid1b mutant, whereas the genes switched-on in TACs exhibited significantly earlier activation in the Arid1b mutant. This was especially true of proliferation-related genes, such as Mki67, Top2a, and Cdk1 (Fig. 2m). This data indicated that loss of Arid1b may induce MSC proliferation. To confirm that the loss of Arid1b stimulates the proliferation of slow-cycling MSCs in vivo, we performed co-immunostaining of LRCs and Ki67 in the mouse incisor. The results revealed an increased number of LRC+ cells co-labeled with Ki67+ in Arid1b mutant mice compared to controls (Fig. 2n–r), indicating that the loss of Arid1b leads to the proliferation of MSCs. Taken together, these results suggested that the loss of Arid1b disturbs MSC quiescence and leads to the proliferation of MSCs.
ARID1B directly suppresses BAF subunit Bcl11b expression in the MSC region to maintain tissue homeostasis
To investigate the downstream mechanisms of ARID1B in regulating the MSC population, we performed bulk RNA-seq to compare transcriptional profiles between control and Gli1-CreER;Arid1bfl/fl mouse incisors. Hierarchical clustering and volcano plots revealed distinct transcriptional profiles between the two groups, identifying 155 upregulated and 55 downregulated genes (false discovery rate [FDR] ≤ 0.1; fold change < −1.5 or > 1.5) in Gli1-CreER;Arid1bfl/fl mouse incisors (Fig. 3a, Supplementary Fig. 5a). We then conducted a comprehensive analysis and listed the top 20 differentially expressed genes and significantly changed signaling pathways based on the upregulated and downregulated genes (Fig. 3b, Supplementary Fig. 5b, c). Using the scRNA-seq data, we plotted the top 20 changed genes (Supplementary Fig. 5d). Among these genes, Bcl11b showed specific enrichment in the MSC and proximal dental follicle (PDF) clusters, colocalizing with Gli1 expression (Fig. 3c). We compared its expression level within dental mesenchymal cells and observed its upregulation in Arid1b mutant mouse incisors (Fig. 3d). To confirm the expression pattern of Bcl11b in vivo, we colocalized Bcl11b with GLI1+ cells and found that Bcl11b is expressed in the proximal region of the mouse incisor surrounding the NVB and colocalized with GLI1+ cells (Fig. 3e, h). Furthermore, we confirmed the upregulation of Bcl11b expression in Arid1b mutant mouse incisors compared to the control (Fig. 3f, g, i–k). Taken together, these findings gave a strong indication that Bcl11b might act as a functional downstream target of ARID1B to regulate MSC quiescence. Additionally, considering that Bcl11b encodes a subunit of the BAF complex, it is essential to investigate the inter-regulation among the BAF subunits.
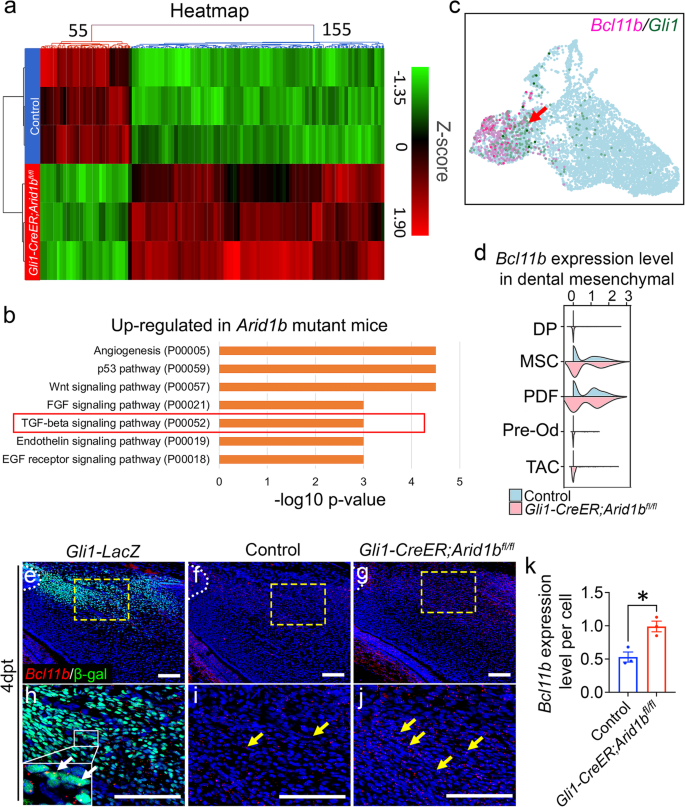
a Heatmap of bulk RNA-seq data for the proximal region of control and Gli1-CreER;Arid1bfl/fl mouse incisor at 4 days post-tamoxifen induction. b Top 7 signaling pathways identified by GO analysis using upregulated genes identified from bulk RNA-seq analysis. c FeaturePlot of Bcl11b and Gli1 expression in the control mouse incisor sample. The red arrow points to the co-localized positive cells. d ViolinPlot of Bcl11b expression levels in control and Gli1-CreER;Arid1bfl/fl mouse incisor mesenchymal cells. e, h In situ hybridization of Bcl11b (red) and immunostaining of β-gal (green) in Gli1-LacZ mouse incisor. h represents a high-magnification image of the box in (e). The white dotted line outlines the cervical loop. White arrows point to the positive cells. n = 3. f, g, i, j Comparison of Bcl11b (red) expression in control (f, i) and Gli1-CreER;Arid1bfl/fl (g, j) mouse incisors at 4 days post-tamoxifen induction. i, j represent high-magnification images of the boxes in (f, g), respectively. The white dotted line outlines the cervical loop. Yellow arrows point to the positive signals. k Quantification of the Bcl11b expression level per cell in (i, j). Data are mean ± SEM, n = 3, unpaired two-tailed Student’s t-test. p = 0.0142. Source data are provided as a Source Data file. Scale bars, 100 μm.
To investigate how ARID1B suppresses Bcl11b expression, we conducted single-cell transposase-accessible chromatin sequencing (scATAC-seq) using the proximal region of incisors from both control and Gli1-CreER;Arid1bfl/fl mice 4 days after tamoxifen induction. By analyzing and integrating the sequencing data from control and Arid1b mutant mice using Signac and marker analysis, we identified distinct cell clusters (Fig. 4a, Supplementary Fig. 6). Gli1 putative gene activity was found to be significantly enriched in the MSC population (Fig. 4b). To compare the differences in chromatin accessibility specifically within the proximal mesenchyme cells between the control and Arid1b mutant mice, we categorized the cells into Control-MSC, Mutant-MSC, and other clusters (Fig. 4c). We generated the normalized signals to visualize the DNA accessibility and annotated peaks for Bcl11b. The scATAC-seq results revealed that the Mutant-MSC cluster had higher peaks compared to the Control-MSC cluster at the promoter region of Bcl11b, indicating increased chromatin accessibility at the promoter region following the loss of Arid1b (Fig. 4d). These results provided evidence that ARID1B functions as a suppressor of Bcl11b gene expression in the mouse incisor.
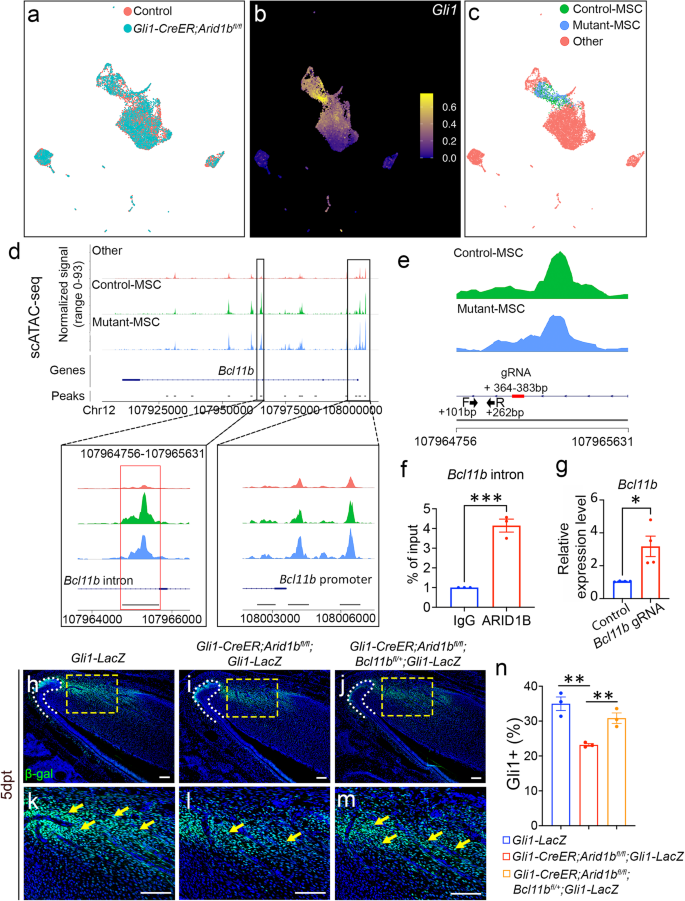
a UMAP visualization of integrated scATAC-seq data from control and Gli1-CreER;Arid1bfl/fl mouse incisors at 4 days post-tamoxifen induction. b FeaturePlot of Gli1 putative gene activity of scATAC-seq data. c Re-clustered UMAP visualization with control-MSC, mutant-MSC, and other clusters. d Peak calling from scATAC-seq at Bcl11b gene. The annotated open chromatin of the changed intron region and promoter region of Bcl11b are enlarged in the box below. e CHIP-qPCR primers and CRISPRi gRNA design at the targeted intron region of Bcl11b. Black arrows indicate the position and direction of forward and reverse primers. Red bolded line indicates the gRNA position. f CHIP assay with ARID1B antibody (or immunoglobulin G [IgG]), followed by qPCR with designed primers at the intron region of Bcl11b. Data are mean ± SEM, n = 3, unpaired two-tailed Student’s t-test. p = 0.0007. g RT-qPCR analysis of Bcl11b expression following CRISPRi treatment with vectors (generated by Origene Technologies) containing control and Bcl11b gRNA. Data are mean ± SEM, n = 4, unpaired two-tailed Student’s t-test. p = 0.0141. h–m β-gal (green) immunostaining of incisors from Gli1-LacZ (h, k), Gli1-CreER;Arid1bfl/fl;Gli1-LacZ (i, l), and Gli1-CreER;Arid1bfl/fl;Bcl11bfl/+;Gli1-LacZ (j, m) mice 5 days post-tamoxifen induction. k, l, m represent high-magnification images of boxes in (h–j), respectively. White dotted lines outline the cervical loop. Yellow arrows point to the positive cells. Scale bars, 100 μm. (n) Quantification of the GLI1+ cells in dental mesenchyme of incisors from Gli1-LacZ, Gli1-CreER;Arid1bfl/fl;Gli1-LacZ, and Gli1-CreER;Arid1bfl/fl;Bcl11bfl/+;Gli1-LacZ mice. Data are mean ± SEM, n = 3, unpaired two-tailed Student’s t-test. Gli1-LacZ vs Gli1-CreER;Arid1bfl/fl;Gli1-LacZ, p = 0.0039; Gli1-CreER;Arid1bfl/fl;Gli1-LacZ vs Gli1-CreER;Arid1bfl/fl;Bcl11bfl/+;Gli1-LacZ, p = 0.0078. Source data are provided as a Source Data file.
To investigate whether ARID1B directly binds to the cis-regulatory elements of Bcl11b to regulate its expression, we compared the peaks between control and Arid1b mutant scATAC-seq data, and identified a reduced peak call at Chr12: 107964756-107965631, corresponding to the Bcl11b third intron region in Arid1b mutant sample (Fig. 4d). To identify whether ARID1B can bind to this 865 base-pair (bp) region, we designed primers within this region and performed ARID1B chromatin immunoprecipitation followed by quantitative PCR (CHIP-qPCR) (Fig. 4e). The CHIP-qPCR results revealed significantly higher DNA binding of ARID1B CHIP compared to the IgG control in the +101 bp to +262 bp binding region (as shown in Fig. 4e between the black arrows), suggesting that ARID1B can directly bind to the intron of Bcl11b to suppress its expression (Fig. 4f). To further validate the functional relevance of this binding site, we performed CRISPRi to specifically target the binding region and assess its effect on the transcriptional activity. It is known that the dCas9 for CRISPRi exerts its binding activity within its gRNA target position with a range of ±150 bp31,32. Accordingly, we designed a gRNA around the qPCR-targeted region with high targeting efficiency and low off-target rate (Fig. 4e). Following CRISPRi treatment of primary cells, we observed a significant increase in the Bcl11b expression level in the group treated with the vector containing Bcl11b gRNA when compared to the group treated with the control vector (Fig. 4g), indicating that the expression level of Bcl11b was upregulated when there was interference with the ARID1B binding site.
Furthermore, to confirm the role of Bcl11b as a key downstream mediator of ARID1B in regulating MSC homeostasis, we generated Gli1-CreER;Arid1bfl/fl;Bcl11bfl/+;Gli1-LacZ mice. By comparing the numbers of GLI1+ MSCs with Gli1-LacZ and Gli1-CreER;Arid1bfl/fl;Gli1-LacZ mice, we aimed to assess the impact of Bcl11b expression on MSC populations in vivo. Through immunostaining, we observed that the reduction of Bcl11b expression in Gli1-CreER;Arid1bfl/fl;Bcl11bfl/+ mice led to the restoration of GLI1+ cells (Fig. 4h–n). These compelling findings strongly supported the notion that Bcl11b serves as the functional downstream target of ARID1B, playing a crucial role in regulating MSC dynamics. Moreover, our data unveiled the direct inter-regulatory interactions between ARID1B and BCL11B during their functional regulation.
BCL11B directly regulates Activin A subunit gene Inhba to modulate Activin signaling
Using the differentially expressed genes identified from bulk RNA-seq, we investigated the significant changes in signaling pathways following the loss of Arid1b in the mouse incisor. Through gene ontology (GO) analysis, we identified highly enriched upregulated and downregulated signaling pathways based on the genes that showed significant increased or decreased expression in Arid1b mutant mice, respectively (Fig. 3b, Supplementary Fig. 5c). Among these pathways, we observed significant changes in angiogenesis and its related p53 pathway, as well as FGF, Wnt, Endothelin, and EGF signaling, with both upregulated and downregulated genes. This suggested that these signaling pathways may not be directly regulated by the loss of Arid1b. TGF-β signaling exhibited significant upregulation in Arid1b mutant mice, indicating that this could be a downstream signaling pathway that undergoes substantial modulation following the loss of Arid1b. We therefore explored the role of TGF-β signaling and sought to determine the specific ligands and receptors involved in maintaining MSC homeostasis.
Previous studies on Bcl11b-deficient mice have shown downregulation of TGF-β family ligands during embryonic incisor development, including BMP4 and activin, leading to disruption of TGF-β signaling33. We thus proposed that TGF-β signaling superfamily may exert as a downstream regulatory effect of BCL11B. To test our hypothesis, we compared the expression patterns and levels of ligands and receptors within the TGF-β superfamily, including TGF-β signaling, Activin/Inhibin signaling, and BMP signaling, using integrated scRNA-seq and bulk RNA-seq data. Our analysis did not reveal significant changes in BMP signaling (Supplementary Fig. 7). However, we observed significant upregulation of Tgfbr1 and Inhba following the loss of Arid1b in the mouse incisor from the bulk RNA-seq data. Inhba encodes a subunit for the Activin signaling ligand, activin A. Notably, when we plotted these ligands and receptors in the scRNA-seq data, we observed that Inhba was predominantly enriched in the PMC and dental follicle clusters, which coincided with Bcl11b expression (Fig. 5a, Supplementary Fig. 8a, b). However, Tgfbr1 exhibited widespread expression in the dental mesenchyme, and according to the JASPAR transcription factor (TF) binding sites prediction tool integrated into the UCSC Genome Brower, there is no predicted binding site for BCL11B at the promoter region of Tgfbr1 (Supplementary Fig. 8b, c). This indicated that the increase of Tgfbr1 may not be directly regulated by BCL11B. Thus, we turned our focus to Inhba as a potential target of BCL11B within the TGF-β superfamily. To further investigate the expression of Inhba and its colocalization with Bcl11b in vivo, we performed in situ hybridization. The staining revealed the colocalization of Inhba and Bcl11b within the MSC region and the dental follicle of the control incisors (Fig. 5b–d), indicating BCL11B may directly regulate Inhba expression.
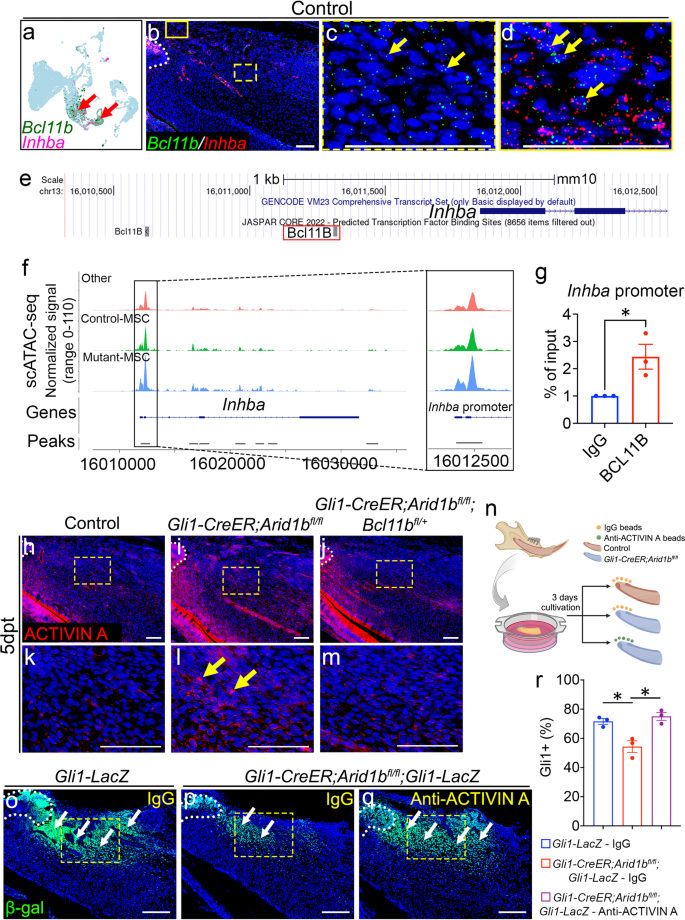
a FeaturePlot shows the colocalization of Bcl11b and Inhba in the control scRNA-seq data. Red arrows point to the co-localized positive cells. b–d in situ hybridization of Bcl11b (green) and Inhba (red) in the proximal region of the mouse incisor. c and d represent high-magnification images of boxes in (b). White dotted line outlines the cervical loop. Yellow arrows point to the co-stained positive cells. n = 3. e UCSC binding prediction of BCL11B binding motif to the promoter region of Inhba. The red box emphasizes the binding site with the highest score. f Peak calling from scATAC-seq at Inhba. The annotated open chromatin at the promoter region of Inhba are enlarged at the right-side box. g CHIP assay with BCL11B antibody (or immunoglobulin G [IgG]), followed by qPCR with primers designed for the promoter region of Inhba. Data are mean ± SEM, n = 3, unpaired two-tailed Student’s t-test. p = 0.0337. h–m Immunostaining of Activin A (red) in the incisors from control (h, k), Gli1-CreER;Arid1bfl/fl (i, l), and Gli1-CreER;Arid1bfl/fl;Blc11bfl/+ (j, m) mice 5 days post-tamoxifen induction. k, l, m represent high-magnification images of boxes in (h–j), respectively. White dotted lines outline the cervical loop. Yellow arrows indicate positive cells. n = 3. n Schematic drawing of the proximal ends of mouse incisors in explant culture created with BioRender.com released under a Creative Commons Attribution-NonCommercial-NoDerivs 4.0 Internatioanl license. o–q β-gal (green) immunostaining of incisor explants of Gli1-lacZ treated with IgG beads (o), Gli1-CreER;Arid1bfl/fl;Gli1-lacZ treated with IgG beads (p), and Gli1-CreER;Arid1bfl/fl;Gli1-lacZ treated with anti-ACTIVIN A beads (q). White dotted lines outline the cervical loop. White arrows indicate positive cells. Yellow boxes indicate the area for quantification. n = 3. r Quantification of the GLI1+ cells in dental mesenchyme of incisor explants. Data are mean ± SEM, n = 3, unpaired two-tailed Student’s t-test. Gli1-LacZ – IgG vs Gli1-CreER;Arid1bfl/fl;Gli1-LacZ – IgG, p = 0.0176; Gli1-CreER;Arid1bfl/fl;Gli1-LacZ – IgG vs Gli1-CreER;Arid1bfl/fl;Gli1-LacZ – ACTIVIN A, p = 0.0125. Source data are provided as a Source Data file. Scale bars, 100 μm (b, h–m, o–q); 200 μm (c, d).
To elucidate the mechanism by which BCL11B, acting as a transcription factor, mediates the regulation of Inhba expression, we investigated the direct binding of BCL11B to the promoter region of Inhba. Utilizing the JASPAR TF binding sites prediction, we identified two potential binding sites located within 1.5 kb upstream of the transcription start site (TSS) in the promoter region (Fig. 5e). We specifically targeted the binding site closer to the TSS, as it exhibited a higher predicted binding score according to JASPAR prediction. We first compared the scATAC-seq data for Inhba and observed higher peaks in the Mutant-MSC cluster compared to the Control-MSC cluster at the promoter region of Inhba (Fig. 5f). This data indicated increased chromatin accessibility at the Inhba promoter region in the Arid1b mutant mice. Furthermore, we designed primers according to the predicted binding motif and performed BCL11B ChIP-qPCR in control mouse incisors. The result revealed significantly higher DNA binding of BCL11B CHIP than the IgG control at the promoter region of Inhba, indicating that BCL11B directly binds to the promoter region and regulates Inhba gene expression (Fig. 5g). These findings provided evidence supporting the direct regulation of Inhba expression by BCL11B.
Furthermore, we examined the ligand activin A level through immunostaining and found that it was primarily deposited in the TAC region, odontoblasts, and dental pulp cells near the odontoblasts in control incisors. We noticed an ectopic upregulation of activin A in the MSC region following the loss of Arid1b, which was restored to normal after reducing Bcl11b level in Arid1b mutant mice (Fig. 5h–m). These findings indicated that BCL11B functionally and directly regulates the expression of the activin A subunit Inhba. Activin A, as the downstream target of BCL11B, undergoes ectopic upregulation in the MSC region within the Gli1-CreER;Arid1bfl/fl mouse incisor. To further explore the impact of ACTIVIN A upregulation in Arid1b mutant mice and its potential effect in the reduction of GLI1+ MSCs, we conducted an explant culture experiment. Using IgG or neutralizing ACTIVIN A antibody-loaded beads, we treated Gli1-LacZ and Gli1-CreER;Arid1bfl/fl;Gli1-LacZ mouse incisor explants (Fig. 5n). Immunostaining confirmed the decrease of GLI1+ MSCs in the Arid1b mutant mouse incisors compared to controls treated with IgG (Fig. 5o, p, r). Notably, treatment of Gli1-CreER;Arid1bfl/fl;Gli1-LacZ mouse incisor explants with the ACTIVIN A antibody restored the normal level of GLI1+ MSCs, in comparison to IgG treatment (Fig. 5p–r). These findings strongly suggested that ACTIVIN A serves as a functional downstream factor capable of maintaining MSC homeostasis in mouse incisors affected by the loss of Arid1b.
Loss of Arid1b ectopically activates non-canonical Activin signaling, p-ERK, impairing MSC homeostasis
Activin A, the ligand that activates the Activin signaling pathway, belongs to the TGF-β superfamily. Activin A binds to the extracellular domain of a type II receptor, ActRIIA or ActRIIB, then forms a complex with the type I receptor, ActRI or TGFBR1. The type I receptor phosphorylates downstream signaling molecules, leading to the activation of the Activin signaling pathway. Upon ligand binding, TGF-β/Activin receptors activate intracellular signaling pathways such as the canonical Smad-dependent pathway via Smad2/Smad3, and non-Smad pathways including p38 MAPK, JNK, ERK, AKT, NF-κB, and COFILIN signaling34,35. These signaling pathways act in a context-dependent manner, leading to different cellular responses. To investigate changes in Activin signaling activity in the Gli1-CreER;Arid1bfl/fl mouse incisor compared to the control, we initially conducted western blot to assess the changes in the signaling pathways. Interestingly, we observed that p-JNK, p-ERK, and p-COFILIN signaling were elevated following the loss of Arid1b, while p-SMAD2, the readout of canonical TGF-β/Activin signaling, exhibited no significant changes (Fig. 6a, Supplementary Fig. 9). To further corroborate these findings and explore where these signaling pathways were activated in vivo, we performed immunostaining for p-JNK, p-ERK, and p-COFILIN in control and Arid1b mouse incisors. Our data revealed that p-COFILIN and p-JNK were specifically activated within the MSC region, as evidenced by their co-localization with GLI1+ cells, and exhibited heightened expression upon Arid1b loss (Fig. 6b–m). Interestingly, p-ERK, which was not activated in the MSC region of the control incisor, exhibited ectopic activation in the MSC region after loss of Arid1b (Fig. 6n–u). Our data provided robust evidence suggesting that non-canonical Activin signaling pathways play a pivotal role in the regulation of MSC homeostasis.
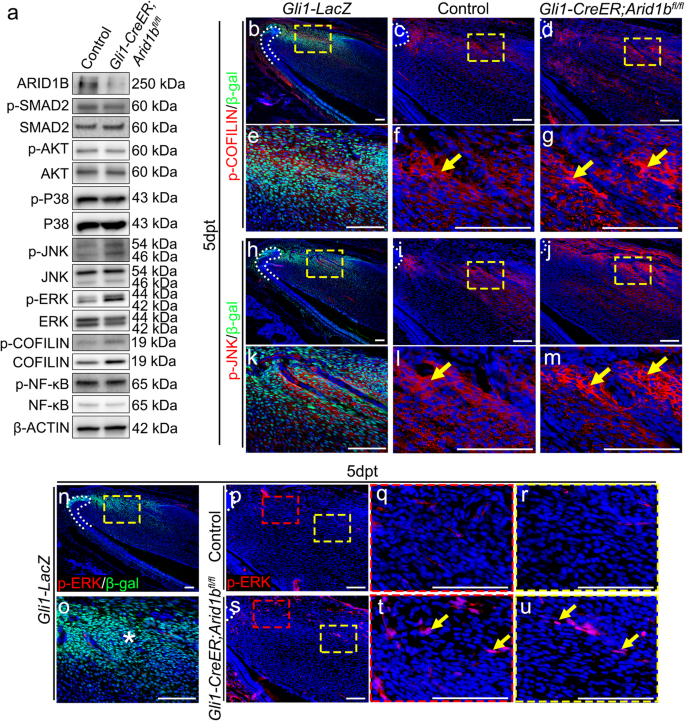
a Western blot of ARID1B, p-SMAD2, SMAD2, p-AKT, AKT, p-P38, P38, p-ERK, ERK, p-JNK, JNK, p-COFILIN, COFILIN, p-NF-κB, NF-κB, and β-ACTIN in proximal incisor mesenchyme from control and Gli1-CreER;Arid1bfl/fl mice. b–g Immunostaining of p-COFILIN (red) with β-gal (green) at Gli1-LacZ mouse incisor (b, e) and comparison of p-COFILIN expression in control (c, f) and Gli1-CreER;Arid1bfl/fl (d, g) mouse incisors. e–g represent high-magnification images of boxes in (b–d), respectively. White dotted lines outline the cervical loop. Yellow arrows indicate positive cells. n = 3. h–m Immunostaining of p-JNK (red) with β-gal (green) in Gli1-LacZ mouse incisor (h, k) and comparison of p-JNK expression in control (i, l) and Gli1-CreER;Arid1bfl/fl (j, m) mouse incisors. k–m represent high-magnification images of boxes in (h–j), respectively. White dotted lines outline the cervical loop. Yellow arrows indicate positive cells. n = 3. n–o Immunostaining of p-ERK (red) with β-gal (green) in Gli1-LacZ. o represents the high-magnification image of (n). White dotted line outlines the cervical loop. The asterisk in (o) represents the absence of co-stained cells. p–u Immunostaining of p-ERK (red) in control (p–r) and Gli1-CreER;Arid1bfl/fl (s–u) mouse incisors. q, r represent the high-magnification image of boxes in (p), t, u represent the high-magnification image of boxes in (s). White dotted lines outline the cervical loop. Yellow arrows indicate positive cells. n = 3. Scale bars, 100 μm.
Additionally, we investigated where p-SMAD2 was activated in both control and Gli1-CreER;Arid1bfl/fl mouse incisors. Our results demonstrated that p-SMAD2 was primarily activated in dental pulp cells and adjacent to GLI1+ cells (Supplementary Fig. 10a–h). This finding identified that Smad-dependent TGF-β/Activin signaling is confined within the differentiated dental pulp compartment, delineating the boundary between the MSCs and dental pulp cells in the mouse incisor. This spatial segregation remained unaltered following the loss of Arid1b at 5 days post-tamoxifen induction.
To determine whether the elevated non-canonical Activin signaling was the cause of the incisor defect observed in the Gli1-CreER;Arid1bfl/fl mice, we generated Gli1-CreER;Arid1bfl/fl;Tgfbr1fl/+ mice as a rescue model. This approach was based on the significant upregulation of Tgfbr1 following the loss of Arid1b (Supplementary Fig. 8b), and the notion that TGFBR1 plays a crucial role in TGF-β/Activin signaling by forming receptor dimers with TGFBR2 and ActRII, transporting signals from intercellular to intracellular. Through in situ hybridization, we detected Tgfbr1 signal widely expressed in the dental mesenchyme, which was upregulated in Arid1b mutant mouse incisors compared to the control (Supplementary Fig. 10i–n). Tamoxifen was injected at 1 month of age to induce Cre activity. At 3 months post-tamoxifen induction, microCT images revealed that the narrowed dental pulp cavity observed in Gli1-CreER;Arid1bfl/fl mice were completely rescued in Gli1-CreER;Arid1bfl/fl;Tgfbr1fl/+ mouse incisors. Moreover, HE staining further confirmed that the incisor defects in the Arid1b mutant mice, such as stacked dentin at the cervical loop, misaligned odontoblasts, and thicker dentin, were also rescued in Gli1-CreER;Arid1bfl/fl;Tgfbr1fl/+ mice. The odontoblast marker Dspp showed that the premature differentiation of odontoblasts was eliminated in the rescue mouse incisor as well (Fig. 7a–i). We assessed the numbers of GLI1+ cells in Gli1-LacZ, Gli1-CreER;Arid1bfl/fl;Gli1-LacZ and Gli1-CreER;Arid1bfl/fl;Tgfbr1fl/+;Gli1-LacZ mice 5 days after tamoxifen induction and confirmed that the reduced number of GLI1+ MSCs observed in the Gli1-CreER;Arid1bfl/fl;Gli1-LacZ mouse incisors was restored in the Gli1-CreER;Arid1bfl/fl;Tgfbr1fl/+;Gli1-LacZ mice (Fig. 7j–p).
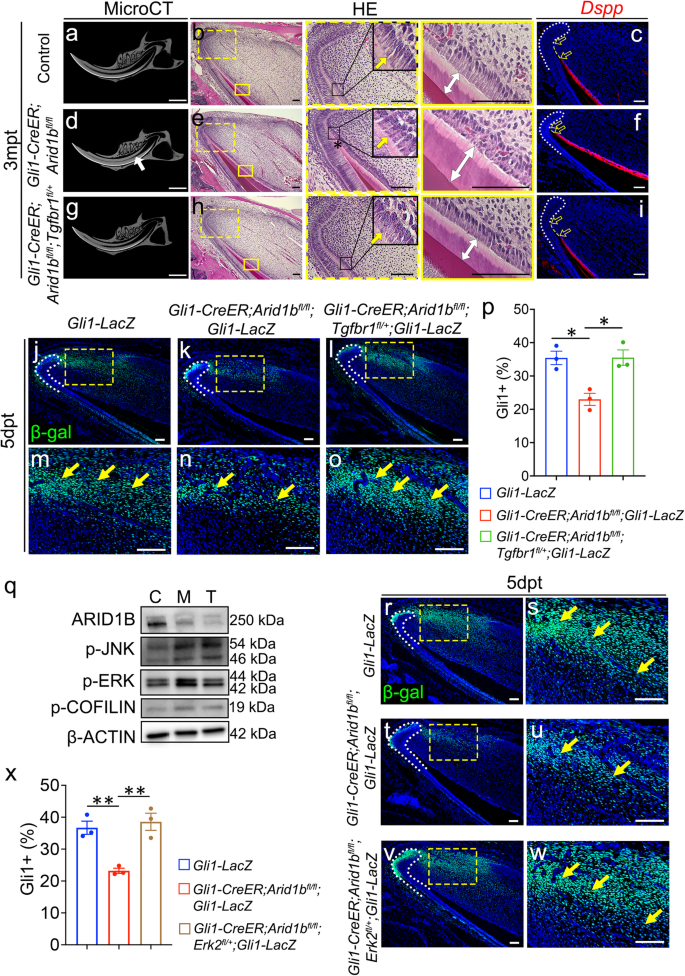
a–i The reduction of Tgfbr1 rescues the phenotypes observed in Gli1-CreER;Arid1bfl/fl mouse incisors. MicroCT (a, d, g), HE staining (b, e, h), and Dspp (red) (c, f, i) in situ hybridization of incisors from control (a–c), Gli1-CreER;Arid1bfl/fl(d–f), and Gli1-CreER;Arid1bfl/fl;Tgfbr1fl/+ (g–i) mice at 3months post-tamoxifen induction. White arrow indicates the narrowed dental pulp. Boxes in (b, e, h) are shown at higher magnification on the right. Yellow arrows indicate the initiation of odontoblast polarization. White two-way arrows indicate the dentin thickness. Black asterisk indicates stacked and distorted dentin. Yellow dotted lines show the distance between the cervical loop bending point and the initiation of the odontoblast. Unfilled arrows indicate the distance of the yellow dotted lines. n = 3. j–o Immunostaining of β-gal (green) in Gli1-LacZ (j, m), Gli1-CreER;Arid1bfl/fl;Gli1-LacZ (k, n), and Gli1-CreER;Arid1bfl/fl;Tgfbr1fl/+;Gli1-LacZ (l, o) mouse incisors. m, n, o represent high-magnification images of the boxes in (j–l), respectively. White dotted lines outline the cervical loop. Yellow arrows indicate positive cells. n = 3. p Quantification of the GLI1+ cells in the dental mesenchyme of incisors from Gli1-LacZ, Gli1-CreER;Arid1bfl/fl;Gli1-LacZ, and Gli1-CreER;Arid1bfl/fl;Tfgbr1fl/+;Gli1-LacZ mice. Data are mean ± SEM, n = 3, unpaired two-tailed Student’s t-test. Gli1-LacZ vs Gli1-CreER;Arid1bfl/fl;Gli1-LacZ, p = 0.0102; Gli1-CreER;Arid1bfl/fl;Gli1-LacZ vs Gli1-CreER;Arid1bfl/fl;Tfgbr1fl/+;Gli1-LacZ, p = 0.013. q Western blot of ARID1B, p-JNK, p-COFILIN, p-ERK, and β-ACTIN in the proximal incisor mesenchyme from control (C), Gli1-CreER;Arid1bfl/fl (M), and Gli1-CreER;Arid1bfl/fl;Tgfbr1fl/+ (T) mice. r–w Immunostaining of β-gal (green) in Gli1-LacZ (r, s), Gli1-CreER;Arid1bfl/fl;Gli1-LacZ (t, u), and Gli1-CreER;Arid1bfl/fl;Erk2fl/+;Gli1-LacZ (v, w) mouse incisors. s, u, w represent high-magnification images of the boxes in (r, t, v), respectively. White dotted lines outline the cervical loop. Yellow arrows indicate positive cells. n = 3. x Quantification of GLI1+ cells in the dental mesenchyme of incisors from Gli1-LacZ, Gli1-CreER;Arid1bfl/fl;Gli1-LacZ, and Gli1-CreER;Arid1bfl/fl;Erk2fl/+;Gli1-LacZ mice. Data are mean ± SEM, n = 3, unpaired two-tailed Student’s t-test. Gli1-LacZ vs Gli1-CreER;Arid1bfl/fl;Gli1-LacZ, P = 0.0037; Gli1-CreER;Arid1bfl/fl;Gli1-LacZ vs Gli1-CreER;Arid1bfl/fl;Erk2fl/+;Gli1-LacZ, p = 0.0055. Source data are provided as a Source Data file. Scale bars: 2 mm (a, d, g); 100 μm for the rest of the images.
Furthermore, to investigate whether the dysregulated non-canonical Activin signaling had been restored in the Tgfbr1 rescue mouse model, we performed western blot analysis of p-JNK, p-ERK, and p-COFILIN on control, Gli1-CreER;Arid1bfl/fl, and Gli1-CreER;Arid1bfl/fl;Tgfbr1fl/+ mouse incisors. Notably, only the p-ERK signaling showed obvious restoration, suggesting that it plays a key role in the non-canonical Activin signaling associated with the loss of Arid1b in the mouse incisors (Fig. 7q). To validate that the p-ERK signaling pathway is the functionally downstream, we generated Gli1-CreER;Arid1bfl/fl;Erk2fl/+;Gli1-LacZ mice. By comparing GLI1+ cell populations among Gli1-LacZ, Gli1-CreER;Arid1bfl/fl;Gli1-LacZ, and Gli1-CreER;Arid1bfl/fl;Erk2fl/+;Gli1-LacZ mouse incisors, we observed the restoration of GLI1+ cells in the Erk2 rescue mouse model (Fig. 7r–x). Ultimately, the loss of Arid1b led to the activation of p-ERK signaling in MSCs following activin A ligand binding to TGFBR1-associated receptors. The aberrant p-ERK signaling disrupted MSC homeostasis and diminished their population.
- SEO Powered Content & PR Distribution. Get Amplified Today.
- PlatoData.Network Vertical Generative Ai. Empower Yourself. Access Here.
- PlatoAiStream. Web3 Intelligence. Knowledge Amplified. Access Here.
- PlatoESG. Carbon, CleanTech, Energy, Environment, Solar, Waste Management. Access Here.
- PlatoHealth. Biotech and Clinical Trials Intelligence. Access Here.
- Source: https://www.nature.com/articles/s41467-024-48285-2