Chemical composition and yield of EOs
Using the extraction method, the yield of S. officinalis L. and S. lavandulifolia subsp. mesatlantica EOs were 1.37 ± 0.8% and 0.86 ± 0.3% respectively. Similarly, the concentration of EOs in both plants was variable. In S. officinalis, the concentration was 750 mg/mL compared to 600 mg/mL in EOs of S. lavandulifolia. For S. officinalis, similar results were recorded currently in areal parts. Hazrati et al.46 investigated the yield of EOs based on microwave gravity and hydrodiffusion (MHG), in addition to microwave-generated hydrodistillation (MGH) for extraction. Results showed that harvesting from 4:00 to 6:00 p.m. revealed the maximum EO percentage estimated at 1.14%, whereas harvesting from 04:00 to 06:00 a.m. indicated the smallest EO percentage estimated at 0.599%.
In another study, the yield in essential oils from leaves S. officinalis was 2.25% for essential oil dried for twenty-one days and about 1.91% during seven days28, which are variable compared with our results. Therefore, the variation of yield and concentration of essential oils of S. officinalis between our samples and those of previous studies is suggested to be related to the difference in used extraction methods, parts of the plants used and drying techniques. Boutebouhart et al.28 investigated the effect of extraction and drying methods on the yield of essential oils from S. officinalis. The yield was significantly variable depending on the extraction method, drying technique, and period. On the other hand, despite the lower yield of S. lavandulifolia subsp. mesatlantica, this is the first study that focuses on the extraction of EOs from this wild subspecies. Therefore, detailed studies are needed to get deep insight into the effect of extraction methods, solvents, and parts of the plant on the yield and concentrations.
The important result for the composition (The chemical profile of EOs in both Salvia species) is presented in Table 1. The GC/MS analysis revealed 20 (total%) and 10 (total%) chemical constituents in EOs distilled from S. officinalis (Fig. 1) and S. lavandulifolia (Fig. 2), respectively. The main constituents in S. officinalis were Camphor (26.70%), β Thujone (17.14%), and Eucalyptol (16.96%). While, Camphor (39.24%), Eucalyptol (22.01%), and Camphene (9.71%) were the dominant ones in S. lavandulifolia. Both EOs share the dominance of Camphor and Eucalyptol and 10 common phytochemicals representing the total mixture identified in S. lavandulifolia.
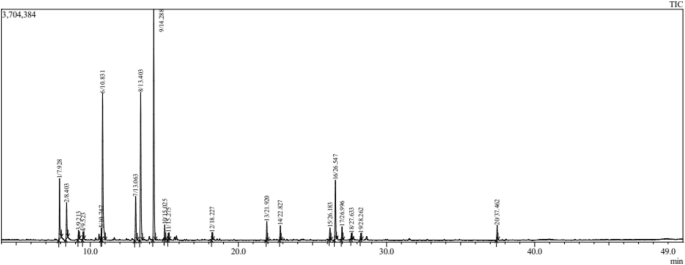
Chromatogram of essential oil from Salvia officinalis L.
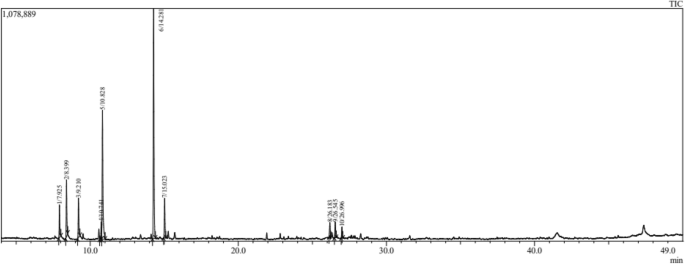
Chromatogram of essential oil from Salvia lavandulifolia.
This study recorded 20 chemical constituents in EOs from S. officinalis L., compared to only 10 constituents in S. lavandulifolia subsp. mesatlantica. In S. officinalis, Camphor (26.70%), followed by β Thujone (17.14%), and Eucalyptol (16.96%) were the major chemicals recorded in EOs. Hazrati et al.46 recorded 32 components in EOs extracted from areal parts of S. officinalis, and the major elements were cis-thujone (34.38–46.18%), followed by 1,8-cineol (8.70–11.07%), and camphor (9.65–14.38%). In another study, Al-Mijalli et al.48 recorded 14 compounds in essential oils of S. officinalis collected from wild areas of Morocco. Thujone (33.77%), followed by Caryophyllene (12.28%), Humulene (12.19%), and Camphor (11.52%) were the primary elements. The lower number of constituents could be due to extraction method, climate conditions, and or soils characteristic in sampled sites.
Maric et al.49 investigated the effect of locality altitudes and development stages on the volatile chemicals of S. officinalis L. from Bosnia and Herzegovina. They revealed that both factors impacted the diversity of chemicals. The quality of chemical composition was constant, while the quantity was variable depending on the altitude and development stage of S. officinalis L. In other studies, Boutebouhart et al.28 and Saša Đurović et al.50 demonstrated that the extraction method affects the chemical composition of essential oils from S. officinalis L.
On the other hand, the diversity of bioactive molecules in the essential oils of S. officinalis compared to S. lavandulifolia increases its biological properties since these compounds are responsible for the biological activities of essential oils and extracts in plants47,51,52. Equally, this is the first study to characterize the chemical profile of S. lavandulifolia in Morocco and the entire Mediterranean area. Compared with other subspecies of S. lavandulifolia, Zrira et al.53 recorded 34 chemical constituents in essential oils from S. lavandulifolia Vahl collected from Morocco. The major components were camphor (16–31%), followed by 1,8–cineole (13–19%), and β-pinene (8–13%). In another study, AENOR54 recorded 12 chemical compounds in the Iberian samples (leaves) of S. lavandulifolia Vahl. A study by Jordán et al.55 reported a wide range of chemicals in S. lavandulifolia subsp. vellerea from South-Eastern Spain. The major chemicals were 1,8-cineol-camphor (23.9–40.7%) and 1,8-cineol-camphor (36.9–31%). The variation of quality and quantity of chemicals in essential oils of our samples and those of the S. lavandulifolia Vahl is suggested to be governed by the synthetic pathways of secondary metabolism in both subspecies. However, more investigations are needed to clarify this issue between subspecies and species of the same genus.
Antioxidant activity
Scavenging of the free radical DPPH
The effect of essential oils extracted from both S. officinalis and S. lavandulifolia on DPPH inhibition is summarized in Table 2. Essential oils of both medicinal plants showed important free radical (DPPH) scavenging action. However, the value of DPPH (free radical scavenging action) was significantly higher in S. lavandulifolia (92.97%) compared to S. officinalis (75.20%) (p < 0.001). On the other hand, the IC50 of S. lavandulifolia was estimated at 34.55 mg/mL, while the IC50 of S. officinalis was estimated at 40.72 mg/mL.
Reducing power (FRAP)
The results of antioxidant activity, measured by the FRAP method, of EOs are presented in Fig. 3. Generally, S. officinalis exhibited higher potential than S. lavandulifolia. The FRAP activity for both species varied proportionally to the concentration, where the maximum inhibition values (72.08% ± 0.75 for S. officinalis and 64.61% ± 1.15 for S. lavandulifolia) have been recorded at 1 mg/mL. The statistical tests confirmed the significant difference of FRAP between essential oils of both plants (t = 9.658, df = 4, p = 0.001).
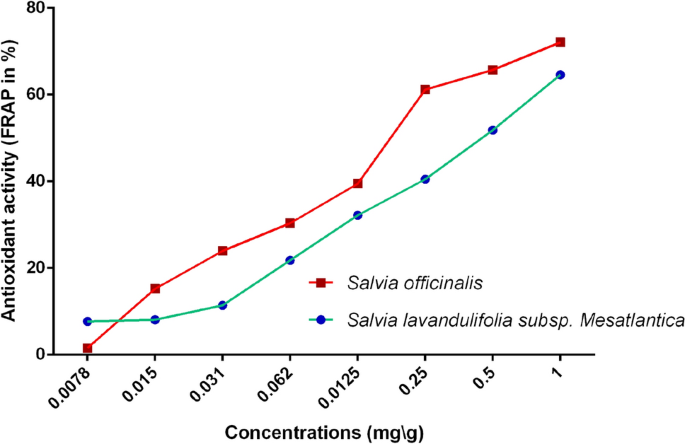
antioxidant activity (FRAP assay) of essential oils of S. officinalis and S. lavandulifolia.
Total antioxidant capacity (TAC)
A comparison of total antioxidant capacity (TAC) between the essential oils of S. officinalis and S. lavandulifolia is presented in Table 2. Essential oils of both plants showed interesting antioxidant capacity. However, the highest total antioxidant capacity was recorded in S. lavandulifolia (49.941 mg EAA/g DW) compared to S. officinalis (36.349 mg EAA/g DW).
The antioxidant activity was heavily investigated for essential oils of S. officinalis compared to S. lavandulifolia28,56,57,58. Boutebouhart et al.28 investigated the antioxidant activity in essential oils from leaves of S. officinalis L. cultivated in Algeria. The essential oils (EOs) were obtained by different extraction techniques: microwave-assisted hydrodistillation (MAHD), conventional hydrodistillation (HD) technique, and steam distillation (SD). In Sage MAHD the Scavenging of the Free Radical DPPH ranged from 7.43 ± 1.06% to 34.72 ± 0.63%, 9.69 ± 2.12% to 36.75 ± 1.25% for Sage HD, and 9.75 ± 1.23% to 40.25 ± 0.85% for Sage SD28. Currently, Tundis et al.47, evaluated the antioxidant activity in three samples of S. officinalis essential oils from Italy: samples from Orsomarso (S1); from Civita (S2), and from Buonvicino (S3). The results showed that the IC50 of S1 was 31.58%, 35.33% in S2, and 32.52% in S3. These values are inferior compared to our results, and this difference is suggested to be controlled by the origin of used materials. In our case, we used wild S. officinalis, known for their higher antioxidant activities than cultivated varieties48,59. On the other hand, Asensio-S.-Manzanera et al.60, investigated the antioxidant activity in S. lavandulifolia and two other plants Lavandula latifolia and Thymus mastichina collected from Spain. The scavenging effect on DPPH ranged between 61 and 89% in spike lavender. These values are very close to our results in Moroccan wild S. lavandulifolia. The similarity of our results with those studies concerning the other subspecies of S. lavandulifolia could be due to similarity of extraction methods, used protocols, and the origin of samples (all samples were from the wild and Mountainous areas).
Tundis et al.47 evaluated the antioxidant activity in essential oils of S. officinalis from three samples in Italy: S. officinalis from Orsomarso (S1), S. officinalis from Civita (S2); S. officinalis from Buonvicino (S3). The obtained results showed that the FRAP of S1 was 3.11 ± 1.61 μM Fe (II)/g, 0.73 ± 0.09 μM Fe (II)/g found in S2, and 1.56 ± 1.02 μM Fe(II)/g found in S3. These authors confirmed that the antioxidant activity of the studied species varies depending on the sampled area, which suggests the potential effects of climate, soil, and other factors. Concerning the subspecies of S. lavandulifolia (subsp. Mesatlantica), our study presents the first investigation of its antioxidant activity, which is suggested to offer data for future studies.
Antimicrobial activity
Determination of inhibition zone and minimum inhibitory concentration MIC and minimum bactericide concentration MBC
The results of the inhibitory effects of essential oils of both S. officinalis and S. lavandulifolia against tested microorganisms are presented in Table 3. Essential oils of both plants showed important and variable inhibitory effects against tested bacteria and yeast. The best antibacterial activity was shown by the essential oil from S. officinalis and the essential oil from S. lavandulifolia, with the smallest MIC values against P. mirabilis (0.29 mg/mL), as well as against B. subtilis and P. mirabilis (1.87 mg/mL each), respectively. Similarly, the best MBC values obtained from S. officinalis and S. lavandulifolia essential oils are against P. mirabilis and B. subtilis. C. albicans‘ MIC values ranged from 3.75 to 4.69 mg/mL. While S. aureus required an even higher concentration of the S. officinalis essential oil (18.75 mg/mL) to inhibit bacterial growth, it only needed 3.75 mg/mL from the S. lavandulifolia essential oil. Lower MBC values were found against P. mirabilis using S. officinalis essential oil (1.17 mg/mL), as well as against P. mirabilis and B. subtilis using S. lavandulifolia essential oil (3.75 mg/mL). Based on the MIC/MBC ratio, essential oils of both Salvia species showed bactericidal effects against all tested microorganisms (Fig. 4) (MBC/MIC ratio ≤ 2 is considered as bactericidal and > 2 is considered as bacteriostatic (inhibition)).
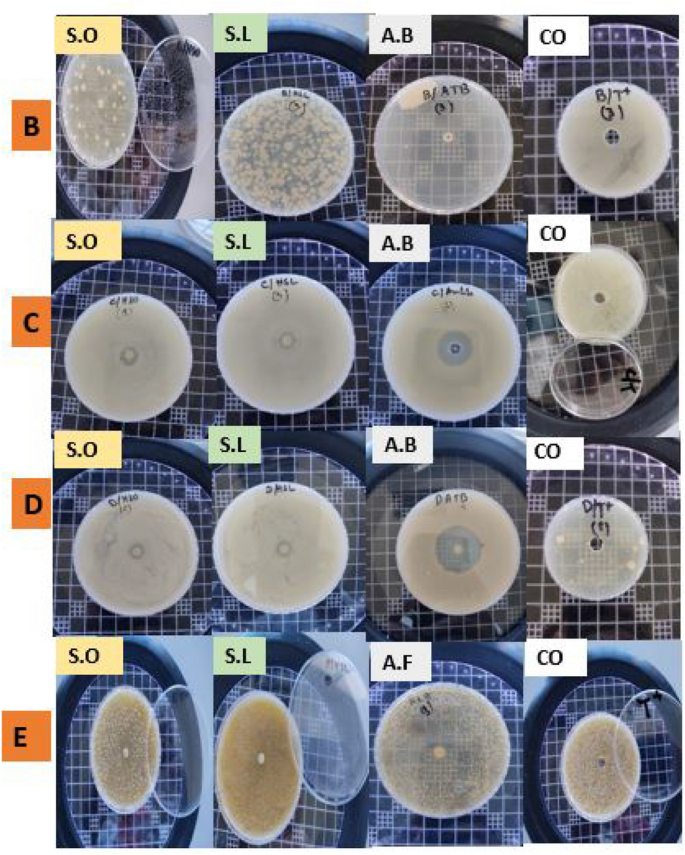
Bactericidal effect of SO and SL samples tested against bacteria and yeasts. (B = Staphylococcus aureus; D = Proteus mirabilis; C = Bacillus subtilis; E = C. albicans; SO = S. officinalis; SL = S. lavandulifolia subsp. Mesatlantica; A.B = antibiotic; A.F = antifungal; CO = control with bacteria only).
The antimicrobial effect of extracts prepared from diverse parts of S. officinalis was investigated heavily28,61. Boutebouhart et al.28 investigated the inhibitory effects of essential oils from areal parts (leaves) of cultivated S. officinalis L. against (i) Bacteria counting S. aureus (ATCC 6538P), B. subtilis (ATCC), Escherichia coli (ATCC 43,300), and P. aeruginosa (ATCC 27,853), (ii) Filamentous fungi counting Aspergillus carbonarius (M333) and Umbelopsis ramanniana (NRRL 1829), and (iii) Yeast namely C. albicans (ATCC 10,259). Except for P. aeruginosa (ATCC 27,853) and C. albicans (ATCC 10,259), essential oils of S. officinalis showed significant inhibitory effects with variable inhibition zones. Aćimović et al.61 tested the inhibitory effects of essential oils extracted from cultivated S. officinalis in Serbia against S. aureus (8684), P. aeruginosa (8762), Enterobacter cloacae (8923), C. albicans (8937), E. coli (8965), Klebsiella oxytoca (8929), and blood cultures Klebsiella pneumoniae (H2807) and S. aureus (H2846). In another study, essential oils of S. officinalis showed MIC values estimated at 191.83 against E. coli, 383.00 against K. pneumonia, > 512 against E. faecalis, and 96.05 against S. aureus7. All tested microorganisms were sensitive to S. officinalis essential oils. These findings confirm the large antimicrobial spectrum of S. officinalis essential oils against bacteria, fungi, and yeast. These biological activities are directly supported by the diversity and abundance of bioactive molecules in essential oils of S. officinalis61,62.
As far as our literature survey could ascertain, there is no published data on the antimicrobial activity of S. lavandulifolia subsp. mesatlantica. The inhibition rates (MIC and MBC) recorded for all tested bacteria and fungi are significantly inferior compared to those recorded for S. officinalis. In terms of comparison, previous studies7,63 investigated the composition of essential oils in four Salvia species including S. lavandulifolia, S. sclarea, S. officinalis, and S. triloba. The Minimum Inhibitory Concentration (MIC) technique and the disk diffusion method were used to investigate their antibacterial activity against 10 pathogens. Gram-positive microorganisms showed greater susceptibility to essential oils. Notably, 2.31 mg mL−1 was the MIC of S. lavandulifolia essential oils against S. aureus, while MIC againt Shigella flexneri was determined to be 9.25 mg mL−1. The major compounds behind this antimicrobial activity were α–β-thujone, camphor, and 1,8-cineole7,63. These elements are abundant in the essential oils of our samples.
The results of inhibition zones against tested microorganisms are presented in (Fig. 5, Table 4). The inhibition zones were variable depending on the used essential oils and tested microorganisms. In SA, the IZ were significantly superior in the essential oil of SO and TH compared to SL. In PM, the IZ was significantly superieur in TH, while it was similar in essential oils of both SL and SO. In BS, the IZ was significantly superior in essential oil of both SL and SO compared to TH. Against CA, the IZ was significantly superior in essential oils of SO, while it was similar between essential oil of SL and FL.
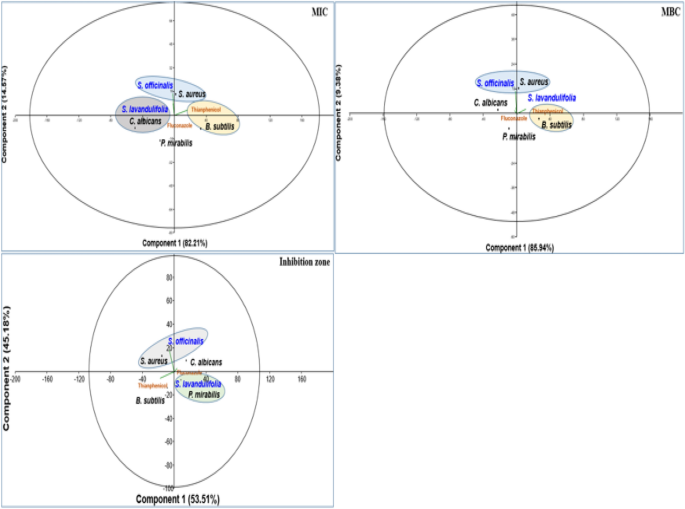
PCA plot showing the efficacy of tested essential oils of both plants (Salvia officinalis and S. lavandulifolia) and commercial antimicrobials.
In terms of comparison among the microorganisms for the same essential oils, IZ was also variable. For SO, the highest IZ was recorded in against ST, followed by CA, while it was similar between PM and BS. In contrast, the IZ of essential oil from the SL was similar among all microorganisms.
The PCA plot confirms the efficacy of each essential oil against tested microorganisms. Essential oils of SO are effective against SA, while essential oils of SL are effective against PM.
In North Africa, Hayouni et al.64 tested the inhibitory effect of essential oils from Tunisian S. officinalis L. against Salmonella inoculated in minced beef meat. The results showed that the inhibition zone varied from 9 to 36 mm, which agrees with our results. This is logical since our samples and those of Tinisia are from similar contexts, including climate (i.e. both from North Africa), used parts (leaves) and extraction methods. Similar results were also recorded in samples of SO from Agadir in the South of Morocco with an inhibition zone variable between 5 and 35 mm65, which are similar to our results for SO.
Molecular docking
Table 5 presents the results of the molecular docking of various ligands with the antioxidant protein target 1AJ6. The table includes information on binding affinity, hydrogen-binding Interaction, hydrophobic Interaction, and electrostatic Interaction with distances in Angstrom for each ligand. The binding affinity, represented by the ΔG (kcal/mol) values, indicates the strength of the ligand and protein interaction. A lower ΔG value indicates a stronger binding affinity between the ligand and protein. Based on the table, the ligand “Iso-aromadendrene epoxide” has the strongest binding affinity with a ΔG value of − 6.4 kcal/mol. The table also includes information on the type of interactions that occur between the ligands and the protein target. Hydrogen bonding, hydrophobic, and electrostatic interactions are considered the most significant types of interactions in molecular docking studies.
The residue and distance between the ligand and protein target shows the hydrogen-binding interaction. Hydrogen bonds are intermolecular forces between a hydrogen atom in the ligand and an electronegative atom in the protein. The distance between the hydrogen atom and the electronegative atom is critical, and a shorter distance indicates a stronger hydrogen bond. For instance, the ligand “13-Epimanool” forms hydrogen bonds with ASP45, ARG190, and PHE41 residues with distances of 2.18 Å, 2.98 Å, and 2.169 Å, respectively. The residue and distance between the ligand and protein target show hydrophobic interaction. Hydrophobic interactions occur when non-polar parts of the ligand and protein come in contact. A smaller distance between the non-polar parts indicates a more vital hydrophobic interaction. For example, the ligand “β-Myrcene” forms hydrophobic interactions with ALA47, VAL71, and ILE78 residues with distances of 4.30 Å, 4.00 Å, and 4.94 Å, respectively. The residue and distance between the ligand and protein target also shows the electrostatic interaction. Electrostatic interactions occur between charged atoms in the ligand and protein. A smaller distance between charged atoms indicates a stronger electrostatic interaction. For instance, the ligand “β-Thujone” forms electrostatic interactions with ARG76, GLY77, and ILE78 residues with distances of 3.05 Å, 1.90 Å, and 5.05 Å, respectively. All interactions are also shown in Fig. 6.
The putative 2D and 3D binding mode of investigated compounds with 1AJ6. (A) Binding pocket surface, (B) 3D binding interactions with protein, (C) 3D binding interactions with protein.
Similarly, Table 6 provides the results of molecular docking simulations of various ligands with an antimicrobial protein target, 1R4U. The docking score, hydrogen bonding, hydrophobic and electrostatic interactions with their respective distances in Angstrom are presented for each ligand. The binding affinity or ΔG value, which indicates the strength of interaction between the ligand and the protein, ranges from − 7.2 to − 4.6 kcal/mol. A lower ΔG value indicates a stronger binding affinity between the ligand and protein. Hydrogen bonding is an important interaction between ligands and protein residues, and this table shows the residue and the distance of the hydrogen bond formed with each ligand. Hydrophobic interaction and electrostatic interaction are also important factors that influence ligand–protein binding. This table lists the residues involved in these interactions and their respective distances.
The ligands can be compared based on their binding affinities and the types of interactions formed with the protein residues. Ligands such as Humulenol-II and Iso-aromadendrene epoxide show the strongest binding affinities with ΔG values of − 7.0 and − 7.2 kcal/mol, respectively. Both ligands also form hydrogen bonds with the protein residues TRP106 and HIS104, respectively. In contrast, ligands such as β-Myrcene and α-Humulene have weaker binding affinities with ΔG values of − 4.6 kcal/mol and − 4.8 kcal/mol, respectively. β-Myrcene forms multiple hydrophobic interactions with various protein residues, while α-Humulene forms only one hydrophobic interaction with PHE41. Figure 7 represents all the ligands in 2D and 3D interactive ways for clarification.
The putative 2D and 3D binding mode of investigated compounds with 1R4U. (A) Binding pocket surface, (B) 3D binding interactions with protein, (C) 3D binding interactions with protein.
In comparison, the molecular docking results in Tables 5 and 6 suggest that some of the tested ligands have strong binding affinities and favorable interactions with the antioxidant and antimicrobial protein targets. These findings provide valuable insights for developing new compounds with potential antioxidant and antimicrobial activity. The ligand “Iso-aromadendrene epoxide” was found to have the strongest binding affinity with the antioxidant protein target 1AJ6. In contrast, the ligands “Humulenol-II” and “Iso-aromadendrene epoxide” showed the most potent binding affinities with the antimicrobial protein target 1R4U. Interestingly, “Iso-aromadendrene epoxide” was found to have a strong binding affinity with both protein targets, indicating its potential as a multi-targeted drug candidate.
Furthermore, the analysis of the interactions between the ligands and protein residues provides insights into the specific mechanisms of ligand–protein binding. These findings can be used to guide the rational design and optimization of new compounds with improved antioxidant and antimicrobial activity. Overall, the results of these molecular docking simulations are promising and provide a starting point for further experimental validation of the identified ligands.
- SEO Powered Content & PR Distribution. Get Amplified Today.
- PlatoData.Network Vertical Generative Ai. Empower Yourself. Access Here.
- PlatoAiStream. Web3 Intelligence. Knowledge Amplified. Access Here.
- PlatoESG. Automotive / EVs, Carbon, CleanTech, Energy, Environment, Solar, Waste Management. Access Here.
- PlatoHealth. Biotech and Clinical Trials Intelligence. Access Here.
- ChartPrime. Elevate your Trading Game with ChartPrime. Access Here.
- BlockOffsets. Modernizing Environmental Offset Ownership. Access Here.
- Source: https://www.nature.com/articles/s41598-023-41178-2