In order to optimize conditions for ME of difficult to transfect cells, we designed a durable, dynamic, low-cost electroporation chamber. As shown in Fig. 1A-B, polished 1 × 1 cm sections of 0.024″ thick 316 stainless steel were separated at fixed gap distances ranging from 200–1000 μm, serving as electrodes. Electrodes were then affixed and protected with epoxy on a standard glass slide (Fig. 1B, arrows)., While experiments were routinely performed in a class II-A2 biosafety cabinet with cell solutions confined within the electroporation channel, samples could be cover-slipped for real-time analysis on a standard upright or inverted microscope (Fig. 1C-D). Due to the reduced electrical requirements resulting from the diminished gap size (700 μm shown), electronics such as those commonly employed for electrophysiology are capable of supplying sufficient power for electroporation (Fig. 1E). In fact, further experimentation demonstrated that the electronics required could be wholly replaced by a battery powered Arduino based system with equal efficiency at a cost of < $100 CAD (Fig. 5). Using this system, relative cell permeability was assessed by monitoring the relative rate of fluorescence enhancement of cells to the cell-impermeant marker propidium iodide (PI). Under conditions appropriate for electroporation, a rapid increase in PI fluorescence could be observed in a substantial subpopulation of ES cells within 2 min of electroporation (Fig. 1F).
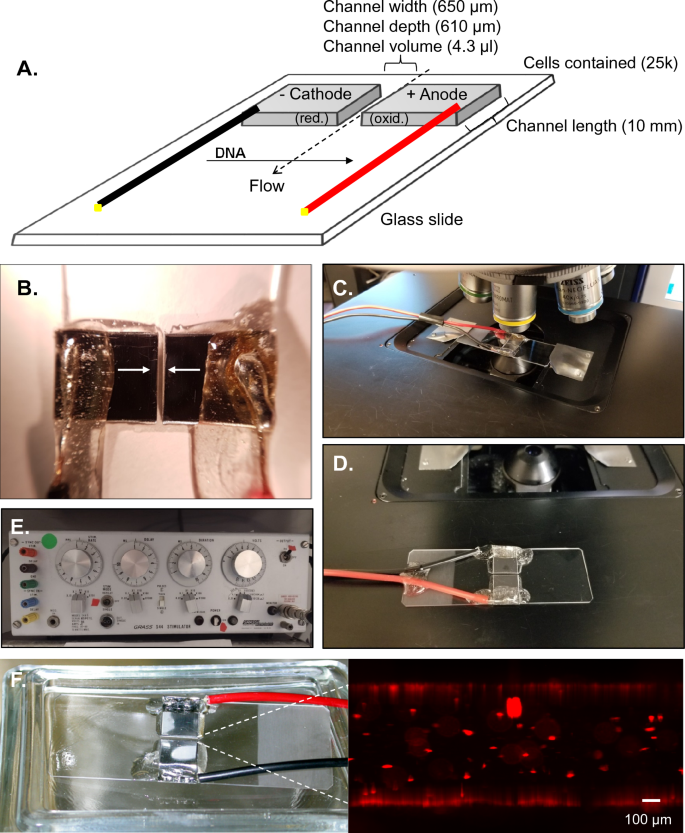
Microelectroporation cell. (A) Schematic overview of unit with most commonly utilized dimensions shown. Cell solution is confined in channel by hydrophobic forces. Direction of electrically induced DNA movement is indicated. (B) Polished 1 × 1 cm sections of 316 stainless steel separated by a gap distance of 650 μm (arrows) with connections soldered and protected using epoxy on a standard glass slide. (C) Reusable unit allowed rapid flushing and real-time inspection of electroporation on standard upright microscope. (D) Alternative attachment is shown. (E) Example of prefab electrophysiology unit which can be utilized for microelectroporation due to reduced gap size and fluidic volume. (F) Example of unit used for electroporation of ES cells, demonstrating development of propidium iodide-positive ES cells within well chamber within 2 min following application of pulsed electroporation. Scale bar represents 100 μm.
Microelectroporation optimization
We next optimized conditions for electroporation of embryonic stem cells using ME. To determine the true efficiency of the system, attempts were made to vary one critical parameter at a time. Results were assessed as a function of viable puromycin resistant colonies recovered following the electroporation of a 14.8 kb plasmid (Addgene #52961) and subsequent puromycin selection. Doing so allowed not only assessment of faithful plasmid uptake and expression, but also resulting ES cell survival, morphology and growth. As shown in Fig. 2A, results were compared between Bio-Rad Gene Pulser with Capacitance Extender and ME using equivalent initial electroporation (5,000 cells/μl), and plating (10,000 cells/well) cell concentrations. Resuspension buffer (EmbryoMax electroporation media) and field strengths (575 versus 571 V/cm) were also kept comparable. Additional set point conditions for Bio-Rad were 800 μl of cell solution in a 4 mm cuvette, absolute voltage 230 V, 500 μF, time constant (τ) = 6.5 ms. For ME values were: 4.3 μl sample volume, voltage 38 V for a gap distance of 700 μm. Based on the Bio-Rad time constant (τ), square-wave pulse sequence was 6 × 1 ms. Changes in DNA reporter concentration from 5–20 μg/ml resulted in consistent and relatively minor alterations in transfection efficiency for the Bio-Rad system (Fig. 2A). By comparison, alterations over this range for the ME resulted in significant alteration of the numbers of puromycin resistant colonies observed, with 5 μg/ml determined to be optimal compared to all other concentrations tested (Fig. 2A). Transfection efficiency as a function of field strength is shown in Fig. 2B, demonstrating a maxima at 575 V/cm for Bio-Rad system and 543 V/cm (applied voltage: 38 V) for ME among the conditions examined. Additional set point parameters for both systems are as given above for Fig. 2A, with the exception that DNA reporter addition was set to 10 μg/ml for both units. The results demonstrate that despite similar field strength maxima, ME demonstrated significantly higher transfection rates at its optimum field strength.
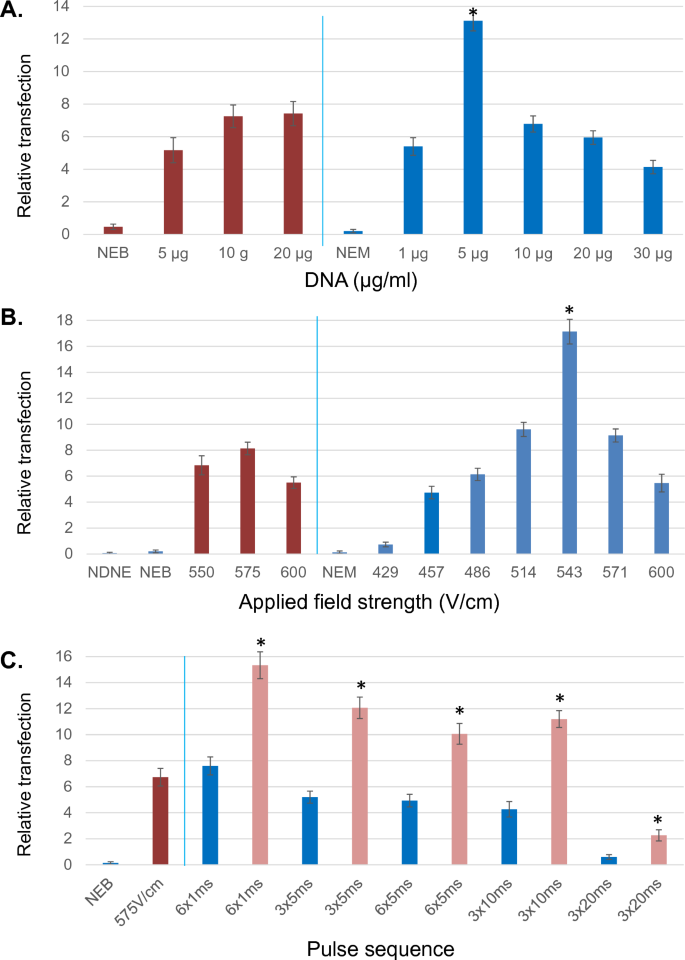
Optimization of microelectroporation. (A) Transfection was examined as a function of DNA reporter concentration; red-Bio-Rad gene pulser, blue-microelectroporator. NEB-no electroporation Bio-Rad, NEM-no electroporation microelectroporator. Experiments were performed in triplicate for each set with n > 4 sets for Bio-Rad conditions, n > 5 sets for microelectroporator. Field strength was set to 575 and 571 V/cm for Bio-Rad versus microelectroporator respectively. Capacitance for Bio-Rad was set to 500 μF and (τ) = 6.5 ms. Pulse sequence used for microelectroporator was 6 × 1 ms. *- Denotes significant enhancement at P < 0.01 over all Bio-Rad conditions. (B) Relative transfection efficiency as a function of applied field strength; red-Bio-Rad gene pulser, blue-microelectroporator. NDNE-no DNA no electroporation. Experiments were performed in triplicate for each set with n > 4 sets for Bio-Rad conditions, n > 5 sets for microelectroporator. DNA reporter set to 10 μg/ml for both systems. Capacitance for Bio-Rad was set to 500 μF and (τ) = 6.5 ms. Pulse sequence used for microelectroporator was 6 × 1 ms. Cells plated at 10 k cells/well in a 6 well. *- Denotes significant enhancement at P < 0.01 over all Bio-Rad conditions. (C) Relative transfection efficiency as a function of square-wave pulse; red-Bio-Rad gene pulser, blue -microelectroporator (plating: 10 k cells/well, 6 well plate), pink-microelectroporator (plating: 50 k cells/well, 6 well plate). Experiments were performed in triplicate for each set with n = 5 sets for both systems. DNA reporter set to 10 μg/ml for both systems, field strength was set to 575 and 571 V/cm respectively for Bio-Rad versus microelectroporator Capacitance for Bio-Rad was set to 500 μF and (τ) = 6.5 ms. *- Denotes significant enhancement at P < 0.01 over lower plating density (10 k cells/well).
A parameter previously shown to significantly affect transfection efficiency is the nature of the square-wave pulse provided. To this end, the efficiency of different pulse wave parameters were examined, with DNA reporter addition set to 10 μg/ml for both systems and field strength set to 575 and 571 V/cm for Bio-Rad and ME respectively. Modification of pulse length to either longer time periods, or greater pulse number did not enhance overall ME transfection efficiency beyond that seen at 6 × 1 ms (Fig. 2C). Thus one millisecond pulses appear capable of generating pores of sufficient size and longevity to allow the uptake of a 14 kb plasmid to occur. However given that embryonic stem cells are known to exhibit significant density dependence with respect to cell survival, it is possible that a portion of transfected cell die subsequently, an effect which might be rescued by enhancing cell density. As such the efficiency of transfection was examined as a function of plating density. As shown in Fig. 2C, increasing plating density from 1,042 cells/cm2 (10 k cells/well of 6-well plate) to 5,208 cells/cm2, demonstrated significant enhancement in relative transfection at higher plating density compared to lower plating density for all pulse parameters examined (all results presented corrected to 1042 cells/cm2).
Despite optimizing transfection efficiency in terms of DNA concentration, field strength and pulse sequence in ME, successful transfection with expression of plasmid-based targets is still only achieved in a minority of cells in difficult to transfect cell lines. One potential source of this inefficiency is the permeabilization characteristics of the targeted population. In order to better understand this process with respect to ME, ES cell morphology was examined as a function of electroporation conditions. Figure 3A demonstrates the major morphologic isotypes observed in the presence and absence of electroporation. For these experiments ES cells expressing monomeric cytoplasmic citrine from the Rosa26 locus were utilized in conjunction with pre-incubation of both the cell permeant marker DNA marker Hoechst 33342 and cell impermeant marker propidium iodide. As shown in Fig. 3, under the most optimal ME transfection conditions examined (543 V/cm, 6 × 1 ms) cells unaffected by electroporation were frequent (PI–, 58 ± 4%, n = 300), exhibiting cytoplasmic citrine fluorescence with only Hoechst staining within the cell nucleus and lacking plasma membrane interruption with propidium iodide entry. By contrast, a minority of cells (PI+, 5 ± 2%) exhibited entry of propidium iodide in the period following electroporation (t = 10 min) without cellular collapse or significant disruption of internal structures (yellow arrow). More prevalent (cell death type 1, 14 ± 4%) were cells presenting PI permeation with early collapse of internal structures and nuclear blebbing (red arrow). Another common isotype (cell death type 2, 23 ± 3%) were cells displaying PI permeation with substantial structural collapse such that cellular volume was ≤ 50% of untransfected cells (brown arrow). Alteration of pulse sequences to longer time periods (5, 10 and 20 ms) increased relative numbers of cell death type 1/2 cells but did not increase numbers of ‘PI+’ cells, mirroring transfection effects (Fig. 2C). Therefore a more extended series of shorter (1 ms) electroporation pulses may be a more optimal approach to enhancing transfection efficiency.
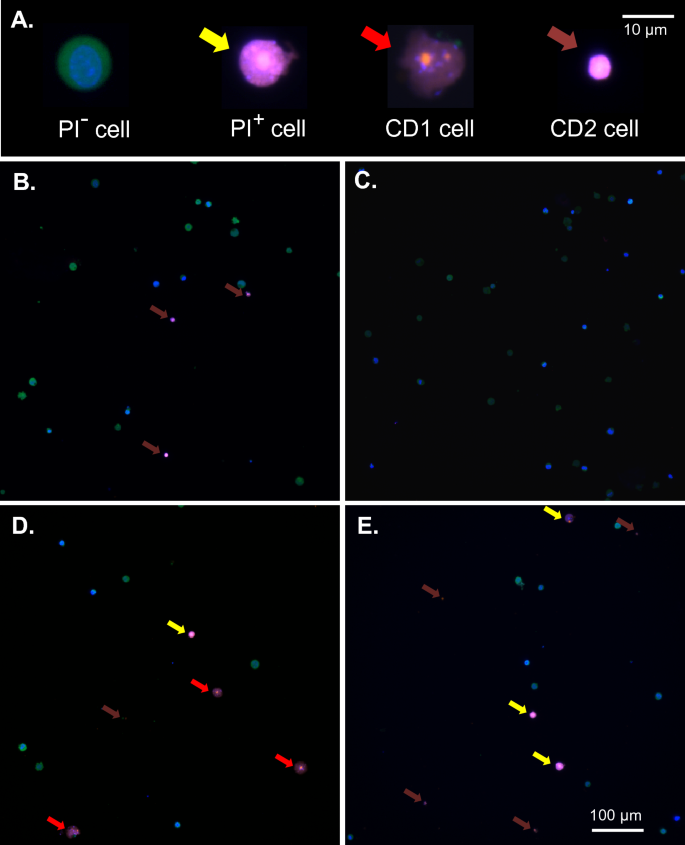
Electroporation isotypes. (A) Examples of the morphology of major ES cell isotypes observed before and following electroporation. CD1/2 = cell death type 1/2. Scale bar represents a distance of 10 μm. (B–E) Examples of pre- (B, C) and post- (D, E) electroporated average fields. Scale bar in (E) represents a distance of 100 μm. Where indicated cells are shown 10 min following electroporation (ME: 543 V/cm, 6 × 1 ms), in which citrine-expressing ES cells were pre-incubated with both the cell permeant marker Hoechst 33342 and cell impermeant marker propidium iodide. Cell types were broadly defined as: PI- cells displaying no membrane disruption or permeation of PI; PI+ cells exhibiting PI permeation without significant disruption of internal structure (yellow arrows); PCD1 cells displaying PI permeation with early collapse of internal structures (red arrows); PCD2 cells displaying PI permeation with complete collapse of cellular volume to < 50% of PI- cells (brown arrows).
To further examine the electroporation efficiency of both Bio-Rad and ME electroporators in cell lines recalcitrant to transfection, primary murine fibroblasts and human T lymphocyte Jurkat cells (clone E6-1) were examined at several conditions as shown in Supplemental Figure S1. For purposes of comparison, conditions were set to those previously reported as optimal for the Bio-Rad electroporator. For both cell types and ME and Bio-Rad electroporators, cell and DNA concentration were kept at a constant (3000 cells/μl, 20 μg/ml mRuby3/mClover3 fluorescent expression vector-Addgene #74252), despite these parameters being outside the observed optimum for ME electroporation of ES cells (5 versus 20 μg/ml, Fig. 2A). With respect to primary fibroblasts, Bio-Rad and ME electroporators exhibited similar efficiencies at their observed optimums (Bio-Rad-800 V/cm, 4 mm cuvette, τ = 14.5 ms; ME- 6 × 1 ms). By contrast, for Jurkat cells (Supplemental Figure S1, S2), ME electroporation exhibited significant enhancement over Bio-Rad at its observed optimum (Bio-Rad-800 V/cm, 4 mm cuvette, τ = 16.5 ms; ME-6 × 1 ms). In both cell types under these conditions the observed maxima for ME electroporation conditions appeared at lower field strengths compared to that seen with Bio-Rad. Example fields for both primary fibroblasts, and Jurkat cells are shown for ME and Bio-Rad mediated transfection respectively (Supplemental Figure S1). Interestingly for both cell types, ME-transfected cells routinely exhibited greater fluorescence intensity compared to their Bio-Rad transfected counterparts under optimal conditions.
CRISPR-mediated gene modification using ME
Given that a primary motivating factor for designing the ME system was the performance of CRISPR-mediated gene targeting in embryonic stem cells, we assessed the ability of ME to produce targeted mutations for several loci of interest. An example of this is shown in Fig. 4A, using multiple CRISPR single guide RNAs (sgRNA) targeting exons 4 and 5 of the Casp3 gene. To create sgRNA expressing CRISPR plasmids, CRISPR RNA (crRNA) sequences were cloned into a tracrRNA containing Cas9 expression vector (Addgene #52961). CRISPR sgRNA plasmids were then electroporated at a final concentration of 5 μg/ml (total) with ES cells (5,000 cells/μl) in ~ 5μλ at 543 V/cm (6 × 1 ms) in EmbryoMax electroporation media. Following electroporation, cells were plated at 10,000 cells/well in 6-well dishes and subjected to puromycin selection on days 2, 3, and 5. Five days following antibiotic removal, puromycin-resistant ES colonies were counted, replica plated and analyzed. As shown in Fig. 4B, successful deletion employing both CRISPR sgRNA plasmids would result in a reproducible deletion of a segment of exon 4, exon 5 and the intervening intron, removing a ~ 1267 nucleotide segment. PCR primers utilized for this analysis are shown (blue arrows, Supplementary Table S1).
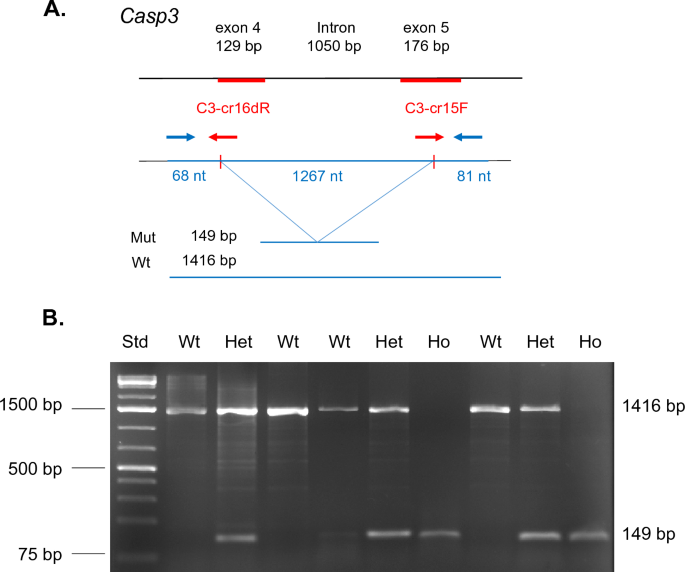
Use of microelectroporation for CRISPR mediated gene editing. (A) Example of stratagem employed for modification of Casp3 locus. Combined action of cloned CRISPR single guides (red arrow) results in a deletion of 1267 nucleotide resulting in a frameshift mutation between exons 3 and 4. In such an event PCR primers (blue arrows) identify a band of 149 bp for the mutant allele versus 1416 bp for wildtype (unmodified) locus. (B) DNA electrophoresis of 9 puromycin-resistant ES cell clones derived following microelectroporation. Examples of wildtype (Wt), heterozygous (He), and homozygous (Ho) modifications are observed. DNA molecular weight standard (Std.) is shown at left.
Using the selection protocol outlined above, we examined the ability of the ME electroporator to produce defined biallelic gene deletions in several target genes of interest via the simultaneous introduction of plasmids encoding CRISPR sgRNAs. The sequence and details of these targeting events are shown in Supplemental Figure S3, together with the genomic deletions induced as determined by direct sequencing of clones. The crRNA sequences used to generate plasmid-encoded CRISPR sgRNAs are shown in Supplemental Table S2. Target sequences for genes of interest were obtained from Ensemble and verified via Sanger sequencing of ES cells for the genetic background of interest (129/Sv). In each case, experimental sequences were identical to those predicted for CRISPR targets despite different genetic backgrounds (C57bl/6 J versus 129/Sv). For each gene locus examined, CRISPR sgRNA plasmid pairs were successful in producing biallelic deletions based on Sanger sequencing of the clone populations obtained (Supplemental Figure S3). Conveniently, such method of targeting could be readily identified by standard PCR. The most common deviation observed in this targeting was that several CRISPRs cleaved 1–3 nucleotides up/downstream of the canonical cleavage site (between nucleotides 3 / 4 upstream of the PAM site). Consistent with prior observations34, CRISPRs varied in their ability to produce biallelic deletions at different genetic loci (caspase-3 WT 48% He 39%, Ho 13%; caspase-8 WT 37%, He 32%, Ho 31%; MLKL WT 23%, He 69%, Ho 8%-of puromycin resistant clones). Despite such differences, none of these frequencies fell below numbers readily obtainable following one ME selection event (> 50 puromycin resistant clones).
Development of microcontroller-based ME wave generator
Having validated the operation of the ME chamber (see Methods), we sought to further improve the flexibility, portability and accessibility of ME by re-engineering its electrical aspects. As a reduction in electroporation volume lowers capacitance requirements, standard electrophysiology stimulators such as that shown in Fig. 1E (Grass S44) could be utilized to generate the frequency, magnitude and duration of waveforms required. However given recent advances and cost reductions in microprocessers, such requirements could also be met by circuitry supported by Arduino-based microcontrollers. We therefore designed the layout of a small scale Arduino-based electroporator, whose capabilities were well within the waveform, voltage and frequency requirements of ME. Transfection experiments comparing the performance of Grass S44 versus Arduino-based electroporator demonstrated no differences. However the Arduino-based microcontrollers significantly reduced the total cost and size of the electroporation unit while maintaining flexibility of waveform generation. Through provision of a detailed parts list, schematics and instructions (see below and Supplemental Figs. 4–5), even those without detailed electronics experience can readily construct an ME electroporator.
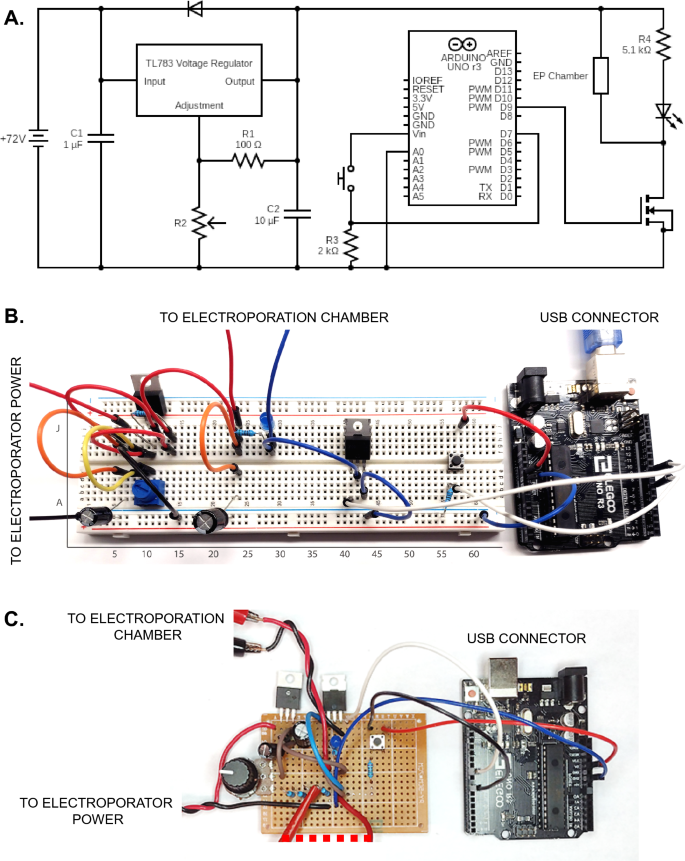
Electroporator schematic and practical examples. (A) Electrical schematic of Arduino based electroporator. (B) Visual example of electroporator assembled on breadboard as indicated, or (C) soldered on a protoboard. Connections from wires to other non-visible components are indicated.
Construction of microcontroller-based ME wave generator
Electroporator parts list. Note: Bolded items were obtained from Arduino starter kit (ELEGOO, EL-KIT-003) but may also be acquired separately. Sources indicated for each component. Due to their low cost, extras of individual components are recommended as backup. Individual components can be obtained from local or online electronics distributors such as Mouser Electronics and Digi-key Electronics, or Amazon for more common items.
-
1 × Arduino Uno R3 and USB cable
-
1 × Breadboard (830 tie points)
-
1 × 4 pin momentary push button
-
17 × Male to male jumper wires
-
1 × each 100 Ω, 2 kΩ, 5.1 kΩ resistors
-
1 × Light emitting diode (LED, through-hole)
-
1 × Adjustable linear voltage regulator (Texas Instruments, TL783CKCSE3).
-
1 × N-channel MOSFET (Infineon, IRF540NPBF).
-
1 × each Capacitors (1 μF and 10 μF) (Nichicon, UVZ2C100MPD, UVZ2C010MED).
-
1 × Diode (ON Semiconductors, 1N4003G).
-
1 × 10 kΩ Potentiometer/Adjustable resistor (Bourns, 3386P-1-103 T).
-
2 × Alligator clips and wires (eBoot, EBOOT-TEST-LEAD-01).
-
8 × 9 V Batteries (Amazon Basics, 6LR1).
As common breadboarding issues involve misaligned or reversed components, an exact position for each component on a standard breadboard is indicated below and shown visually in Figure S2. Components for which directionality is important are identified in Figure S1 and orientation specified below.
Component connections to specific breadboard pins:
- TL783 voltage regulator:
-
J10, J11, J12-Adjustment (A), Output (O) and Input (I) pins respectively
- IRF540N MOSFET:
-
E41, E42, E43-Gate (G), Drain (D), Source (S) pins respectively
- Push button:
-
F56, F58, E56, E58
- Diode:
-
Cathode (side with grey stripe) G7, anode G11
- Light emitting diode:
-
Cathode (short leg) I29, anode (long leg) I28
- Capacitor 1 (1 μF):
-
Cathode (short leg) GND rail, anode (long leg) A7
- Capacitor 2 (10 μF):
-
Cathode (short leg) GND rail, anode (long leg) A24
- R1 (100Ω):
-
I10, I14
- Potentiometer (R2):
-
B10, A11/B11, B12-terminal 1, wiper, terminal 2 pins respectively (see note below)
- R3 (2 kΩ):
-
B56, GND rail
- R4 (5.1 kΩ):
-
G24, G28
- Jumper wires:
-
F7 to E7
F10 to E10
E11 to GND rail
H7 to H12
F11 to F14
H14 to H24
F24 to E24
F29 to D42
A41 to Arduino pin D9
A43 to GND rail
C56 to Arduino pin D7
J58 to Arduino 5 V pin
Arduino GND pin to GND rail
- Open jumper wires:
-
J7 (for positive battery terminal connection)
GND rail (for negative battery terminal connection)
J24 (for positive terminal of ME chamber connection)
G29 (for negative terminal of ME chamber connection).
Additional construction notes: The potentiometer listed in the parts list has the wiper pin offset downwards by one position. Thus it would be attached to position “A11” rather than “B11” (as shown in Figure S2). Open jumper wires from circuit to batteries and ME chamber can be connected via alligator clips or by other means as needed. The Arduino microcontroller can be powered by computer via supplied USB cable or a separate 9 V battery via barrel jack. Output voltage is determined by the equation V ≈ 1.25 x (1 + R2/R1), where R1 is typically a fixed value (we utilize a 100 Ω resistor), with variable R2 resistances (fixed values or variable potentiometer-see below). A standard multimeter can be used to verify R2 resistance or to measure voltage across the electroporation chamber electrodes for greater precision. In place of a potentiometer, fixed resistors for R2 can be used for applications where variable output voltage is not required. Note that theoretical vs. actual voltage output may differ and measurements for the system used in this study are indicated in Figure S2.
Arduino enabling: Software required to communicate with the Arduino (Arduino IDE) is available at https://www.arduino.cc/en/software, which is used to modify and upload code via USB cable (see Figure S2).
Waveform setup The Arduino microcontroller controls pulse duration with several lines of code. The entirety of the code is shown in Figure S2, and can be downloaded from the supplemental data (Momentary_Switch_for_Electroporation.ino) or at db.phm.utoronto.ca/ME.htm. Once uploaded to the Arduino, pressing the push button will result in a single 1 ms pulse to the ME chamber. Pulse duration may be altered by adjusting the source code as shown in Figure S2, specifically by altering the value of “pulseDura” (assumed value in milliseconds) in the source code. Note that upon alteration of any source code, the code must be reuploaded to the Arduino for these changes to take effect. For modifications of pulse duration to values of < 1 ms, change the “delay(pulseDura)” command to “delayMicroseconds(pulseDura)”. This will alter the program to generate a pulse with duration equal to the value of “pulseDura” in microseconds instead of milliseconds.
Circuit testing: For internal verification, the LED will briefly flash once when the push button is depressed, serving as an indicator of power reaching the EP chamber. Changes in output voltage and pulse duration will also be reflected in the intensity and duration of the LED pulse. Direct confirmation of waveform characteristics can additionally be determined using an oscilloscope as shown in Figure S2. Most aspects of the circuit (save absolute output voltage) can be tested using a single 9 V battery for safety.
- SEO Powered Content & PR Distribution. Get Amplified Today.
- PlatoData.Network Vertical Generative Ai. Empower Yourself. Access Here.
- PlatoAiStream. Web3 Intelligence. Knowledge Amplified. Access Here.
- PlatoESG. Carbon, CleanTech, Energy, Environment, Solar, Waste Management. Access Here.
- PlatoHealth. Biotech and Clinical Trials Intelligence. Access Here.
- Source: https://www.nature.com/articles/s41598-024-62996-y