Animals
Animal experiments performed at the University of Oxford were approved by the Oxford Clinical Medicine Ethical Review Committee, and those performed at the Karolinska Institutet were approved by the regional review committee for animal ethics (Stockholms djurförsöksetiska nämnd). All experimental and mouse breeding procedures were performed in accordance with the UK Home Office and Swedish Jordbruksverket regulations.
Young adult (7–14 weeks old) Vwf-tdTomato/Gata1-eGFP mice9,17 (Vwf-tdTomatotg/+ Gata1-eGFPtg/+) and Flt3Cre/Rosa26tdTomato(Ai9)/Vwf-eGFP/Gata1-eGFP mice8,17,59 (Flt3Cretg/+ R26Tom/+ Vwf-eGFPtg/+ Gata1-eGFPtg/+) on a C57BL/6OlaHsd (University of Oxford) or C57BL/6JrJ (Karolinska Institutet) background were used as BM donors in single HSC transplantations. Seven- to 18-week-old wild-type CD45.1 B6.SJL-Ptprca Pepcb/BoyJ (University of Oxford) and B6.SJL-Ptprca Pepcb/BoyCrl (Karolinska Institutet) mice were used as recipients in primary and secondary transplantations, as donors of unfractionated BM competitor cells, and for BM analysis after anti-CD42b antibody treatment. Recipient mice that did not survive or had to be killed before 16–18 weeks after the primary or secondary transplantation were excluded from analyses. Flt3Cre/Rosa26tdTomato(Ai14) mice (Flt3Cretg/+ R26Tom/+; 7–11 weeks old) and VavCre/Rosa26tdTomato(Ai14) mice51 (VavCretg/+ R26Tom/+; 8–23 weeks old) on a C57BL/6JrJ background were used for fate-mapping and CP and 5FU treatment experiments. Flt3Cre/Rosa26tdTomato(Ai9)/Vwf-eGFP/Gata1-eGFP (Flt3Cretg/+ R26Tom/+ Vwf-eGFPtg/+ Gata1-eGFPtg/+; 8–13 weeks old) mice on a C57BL/6OlaHsd background were also used for steady-state fate-mapping and anti-CD42b treatment experiments. Mice were housed in individually ventilated cages at the Oxford JR facility (12/12 h light/dark cycle, 19–24 °C and 45–65% humidity) and the Karolinska Institutet KM facility (12/12 h light/dark cycle, 22 ± 1 °C and 50% humidity).
Single-cell transplantations
Single-cell sorting of adult BM HSCs was performed using a FACSAria II or FACSAria Fusion cell sorter (BD Biosciences), prepared by crushing pelvic and leg bones (and optionally also sternum and spine bones) into PBS with 5% fetal calf serum (FCS; Sigma-Aldrich) and 2 mM EDTA (Sigma-Aldrich). Single phenotypically defined HSCs (Extended Data Fig. 1a) were sorted from Vwf-tdTomatotg/+ Gata1-eGFPtg/+ mice (Vwf-tdTomato+ and Vwf-tdTomato− fractions of LSKGata1-eGFP−CD34−CD150+CD48− or LSKGata1-eGFP−CD34−CD150+CD48−CD201+ cells) and Flt3Cretg/+ R26Tom/+ Vwf-eGFPtg/+ Gata1-eGFPtg/+ mice (Vwf/Gata1-eGFP+ and Vwf/Gata1-eGFP− fractions of LSKCD34−CD150+CD48− or LSKCD34−CD150+CD48−CD201+ cells).
Comparison of single-cell expression and coexpression of Vwf-eGFP and Gata1-eGFP in BM LSKCD34−CD150+CD48− cells showed that <10% express Gata1-eGFP (Extended Data Fig. 7c). Moreover, Gata1-eGFP and CD201 are mutually exclusive in LSKCD34−CD150+CD48− cells, indicating that eGFP expression in LSKCD34−CD150+CD48−CD201+ cells mainly reflects Vwf-eGFP+ HSCs (Extended Data Fig. 7c). Regardless of their cell-surface phenotype, P-HSCs and multi-HSCs were defined based on their long-term lineage replenishment pattern as established by blood lineage analysis at multiple time points (see the next sections).
In experiments with mice that coexpress Vwf-eGFP and Gata1-eGFP, eGFP was used for sorting of single eGFP+ and eGFP− HSCs for transplantation and to identify donor-derived blood platelets (which express both Vwf and Gata1) and erythrocytes (which express Gata1) in the transplantation recipients.
Single HSCs were sorted by an automated cell deposition unit, refrigerated at 4 °C, into 96-well round-bottom plates (Corning) with 100 μl per well of Iscove’s modified Dulbecco’s medium (IMDM, Gibco) with 20% BIT-9500 serum substitute (Stem Cell Technologies), 100 U ml−1 penicillin and 0.1 mg ml−1 streptomycin (100× Pen/Strep, Hyclone), 2 mM l-glutamine (Gibco) and 0.1 mM 2-mercaptoethanol (Sigma-Aldrich). Single index-sorted HSCs were mixed with 2–3 × 10⁵ wild-type CD45.1 unfractionated BM competitor cells (100 μl per well) and transplanted by intravenous lateral tail-vein injection into lethally irradiated CD45.1 mice (10–10.5 Gy, cesium-137 or X-ray). BM cell counts were measured manually with a hemacytometer and/or an automated cell counter (Sysmex XP-300 or ABX Pentra ES 60).
Blood reconstitution analysis
Peripheral blood was collected from a lateral tail vein into lithium–heparin or K3 EDTA microvettes (Sarstedt). The platelet supernatant was collected after centrifugation of blood samples at 100g for 10 min at room temperature. Then, it was mixed with a small fraction (0.5–1 μl) of red precipitate for combined analysis of platelets and erythrocytes. The remaining precipitate was incubated 1:1 with dextran (Sigma-Aldrich, Mr 450,000–650,000) 2% w/v in PBS for 20–30 min at 37 °C. Erythrocytes were lysed by incubation in ammonium chloride solution (Stem Cell Technologies) for 2 min at room temperature. Leukocyte samples were incubated with purified CD16/32 (Fc-block) for 10–15 min at 4 °C. Then, they were stained with anti-mouse antibodies for 15–20 min at 4 °C in PBS with 1–5% FCS and 2 mM EDTA. Samples were analyzed using LSRII and Fortessa cytometers (BD Biosciences). See Supplementary Table 5 for antibody details.
Donor-derived platelets were defined as follows: CD150+CD41+TER119−Vwf-tdTomato+Gata1-eGFP+ for Vwf-tdTomatotg/+ Gata1-eGFPtg/+ donors and CD150+CD41+TER119−Vwf/Gata1-eGFP+ for Flt3Cretg/+ R26Tom/+ Vwf-eGFPtg/+ Gata1-eGFPtg/+ donors. Donor-derived erythrocytes: TER119+CD150−CD41−Vwf-tdTomato−Gata1-eGFP+ for Vwf-tdTomatotg/+ Gata1-eGFPtg/+ donors and TER119+CD150−CD41−Vwf/Gata1-eGFP+ for Flt3Cretg/+ R26Tom/+ Vwf-eGFPtg/+ Gata1-eGFPtg/+ donors. Donor-derived myeloid (granulocyte/monocyte) cells: CD11b+NK1.1−CD19−CD4/CD8a−CD45.1−CD45.2+. Donor-derived B cells: CD19+NK1.1−CD4/CD8a−CD11b−CD45.1−CD45.2+. Donor-derived T cells: CD4/CD8a+NK1.1−CD11b−CD19−CD45.1−CD45.2+. The granulocyte/monocyte identity of CD11b+NK1.1−CD19−CD4/CD8a−CD45.1−CD45.2+ cells from reconstituted recipient mice was confirmed by cytospins stained with eosin Y/azure A/methylene blue (Richard-Allan Scientific Three-Step Stain Set, Thermo Fisher Scientific) (Supplementary Fig. 4).
Categorization of reconstitution patterns
All five mature blood cell lineages (platelets, erythrocytes, myeloid cells, B cells and T cells) were considered. We considered primary and secondary recipients to be reconstituted by HSCs if the donor contribution to platelets was ≥0.1% at ≥16–18 weeks after transplantation9. Mice reconstituted by single Vwf+ P-HSCs and Vwf− multi-HSCs were defined at ≥16–18 weeks after transplantation as follows. Vwf+ P-HSC: donor platelets ≥0.1%; donor platelet percentage ≥50-fold higher than donor erythrocytes and myeloid cells; and donor B and T cells undetectable (≤0.01%). Where indicated (Fig. 7b and Extended Data Fig. 7e,f), the stricter group of platelet-restricted HSCs was considered, in which donor erythrocyte, myeloid cell, B cell and T cell lineages were all below the detection level (≤0.01%). Vwf− multi-HSC: donor platelets ≥0.1%; donor erythrocytes, myeloid cells, B cells and T cells all >0.01%; and donor platelets, erythrocytes and myeloid cells all ≤2-fold higher than B and T cells. Mice reconstituted with multilineage patterns with ≥2-fold platelet, platelet–erythroid and platelet–erythroid–myeloid bias were excluded from the Vwf− multi-HSC group, as such biases are typical of Vwf+ multi-HSCs9.
Reconstitution analysis of HSPCs
BM HSPC reconstitution analysis was performed using FACSAria Fusion, LSRII and LSR Fortessa flow cytometers (BD Biosciences) after crushing pelvic and leg bones (and optionally also sternum and spine bones) into PBS with 5% FCS and 2 mM EDTA, followed by cKIT enrichment according to the manufacturer’s instructions (CD117 MicroBeads and magnetic activated cell sorting (MACS) LS columns, Miltenyi Biotec). cKIT-enriched BM cells were incubated with purified CD16/32 (Fc-block) for 15–20 min at 4 °C, followed by anti-mouse antibody staining for 15–20 min at 4 °C. For the myeloid progenitor panel, cells were incubated with fluorophore-conjugated CD16/32 before further staining. See Supplementary Table 5 for antibody details.
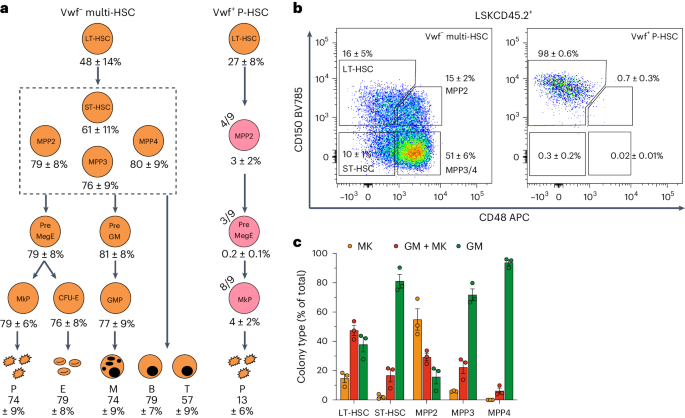
Phenotypic BM populations were defined as follows: LSK, LIN−SCA1+cKIT+; LK, LIN−SCA1−cKIT+; LT-HSC, LSKFLT3−CD150+CD48−; ST-HSC, LSKFLT3−CD150−CD48−; MPP2, LSKFLT3−CD150+CD48+; MPP3, LSKFLT3−CD150−CD48+; MPP4, LSKFLT3+; MkP, LKCD150+CD41+; preMegE progenitor, LKCD41−CD16/32−CD150+CD105−; CFU-E, LKCD41−CD16/32−CD150−CD105+; preGM progenitor, LKCD41−CD16/32−CD150−CD105−; GMP, LKCD41−CD16/32+CD150−CD105−. Cells within each population were considered donor-derived cells when CD45.2+CD45.1− or when Gata1-eGFP+ in the case of CFU-E cells due to their low CD45 expression.
In vitro lineage potentials
Donor-derived (CD45.2+CD45.1−) phenotypic HSC and MPP populations, as defined above, were bulk sorted into Eppendorf tubes with X-VIVO 15 medium containing gentamycin and l-glutamine (Lonza) and supplemented with 10% FCS, 0.1 mM 2-mercaptoethanol, 25 ng ml−1 mouse stem cell factor (PeproTech), 25 ng ml−1 human thrombopoietin (PeproTech), 10 ng ml−1 human FLT3 ligand (Immunex) and 5 ng ml−1 mouse interleukin-3 (PeproTech). The volume of sorted cells was diluted as needed and manually distributed at an average of one cell per well into Terasaki microplates (Thermo Fisher Scientific) at 20 μl per well. The growth of granulocytes/macrophages and megakaryocytes was scored under an inverted microscope after 8 days of culture at 37 °C and 5% CO2 in a humidified incubator. Granulocyte/macrophage and megakaryocyte scores were also confirmed in a representative subset of wells through the analysis of cytospins stained with eosin Y/azure A/methylene blue (Richard-Allan Scientific Three-Step Stain Set, Thermo Fisher Scientific).
Secondary hierarchical transplantations
Secondary transplantations were performed 16–38 weeks after the primary single-HSC transplantation, and a final blood analysis of primary recipients was performed a maximum of 2 weeks before sorting to confirm the reconstitution pattern. BM cell suspensions from primary recipients of a single P-HSC or multi-HSC were prepared by crushing pelvic and leg bones (and optionally also sternum and spine bones) into PBS with 5% FCS and 2 mM EDTA, followed by cKIT enrichment according to the manufacturer’s instructions (CD117 MicroBeads and MACS LS columns, Miltenyi Biotec). Phenotypically defined donor-derived (CD45.2+CD45.1−) HSCs were sorted into supplemented IMDM as described above, mixed with 2–3 × 10⁵ wild-type CD45.1 unfractionated BM competitor cells and transplanted by intravenous lateral tail-vein injection into lethally irradiated CD45.1 secondary recipient mice (10–10.5 Gy, cesium-137 or X-ray).
In some experiments (Supplementary Table 1), all sortable donor-derived (CD45.2+CD45.1−) LSK Vwf-tdTomato+ cells were transplanted while the Vwf-tdTomato− cells were transplanted, keeping the same Vwf-tdTomato+/Vwf-tdTomato− ratio observed within the donor-derived phenotypic HSC compartment (LSKCD150+CD48−CD45.2+). In other experiments (Supplementary Tables 2 and 3), all sortable donor-derived (CD45.2+CD45.1−) HSCs (LSKCD150+CD48− split into Vwf-tdTomato+ and Vwf-tdTomato− fractions or Gata1-eGFP−LSKCD150+CD48− split into Vwf-tdTomato+/CD201+, Vwf-tdTomato+/CD201−, Vwf-tdTomato−/CD201+ and Vwf-tdTomato−/CD201− fractions) were transplanted from each primary donor.
Smart-seq3 single-cell library preparation and sequencing
Single CD45.2+CD45.1−LIN−cKIT+ HSPCs generated in vivo from Vwf-tdTomato+ P-HSCs and Vwf-tdTomato− multi-HSCs were sorted from single-HSC-transplanted mice 24–31 weeks after transplantation (Fig. 3a). In all mice, the lineage reconstitution pattern in the blood was established from at least two time points, the last one performed ≤2 weeks before the isolation of cells for Smart-seq3 processing. From mice reconstituted by Vwf-tdTomato+ P-HSCs, an unbiased isolation of all CD45.2+CD45.1− donor-derived LIN−cKIT+ cells was performed in combination with collection of index-sorting information. From mice reconstituted by Vwf-tdTomato− multi-HSCs, in addition to collection of index-sorting information, a targeted selection of distinct donor-derived HSPCs was performed to ensure that all LIN−cKIT+ compartments were sufficiently represented in the Smart-seq3 analysis.
To detect potential batch variations between individual plates and individual experiments, we combined the BM samples from three 12-week-old wild-type CD45.1 mice and stored them as frozen aliquots. One BM vial was thawed for each experiment, in which each 384-well sorted plate contained 24 GMP and 24 LSK cells from this internal batch control.
As previously described23, single donor-derived LIN−cKIT+ cells and internal control GMP and LSK cells were sorted into 384-well plates with 3 μl of Smart-seq3 lysis buffer containing 0.5 U μl−1 RNase inhibitor (Takara), 0.1% Triton X-100 (Sigma-Aldrich), 0.5 mM dNTPs each (Thermo Fisher Scientific), 0.5 µM Smart-seq3 oligonucleotide-dT primer (5′-biotin-ACGAGCATCAGCAGCATACGAT30VN-3′, IDT) and 5% polyethylene glycol (Sigma-Aldrich). The concentrations of dNTPs, oligonucleotide-dT primer and polyethylene glycol were calculated based on a 4-μl total volume after the addition of 1 μl of reverse transcription mix. Immediately after the sort, each plate was spun down and stored at −80 °C. Generation of the cDNA library was done as previously described23, according to detailed protocols published on protocols.io (https://doi.org/10.17504/protocols.io.bcq4ivyw), with 22 cycles of PCR amplification and using 100 pg of amplified cDNA for tagmentation. The amplified tagmented libraries were pooled, bead purified and analyzed using a high-sensitivity DNA chip (Agilent Bioanalyzer) and quantified using a Qubit fluorometer (Thermo Fisher Scientific). Pooled libraries were sequenced on a NovaSeq S-prime (batch 3) or S4 (batches 1 and 2) 150 × 2-bp paired-end flow cell. FASTQ files from batch 1 were downsampled to 25% to match the sequencing depth from batches 2 and 3 to achieve similar sensitivity in gene detection across batches.
Processing and quality control of RNA-sequencing data
FASTQ files were demultiplexed and mapped to the mouse genome (Genome Reference Consortium Mouse Build 38, Ensembl release 99) using zUMIs (versions 2.9.4cq, 2.9.6 and 2.9.7)23,60, and unique molecular identifier (UMI) reads for each gene were quantified. In line with previous studies61, the exclusion of cells from analysis was based on UMI count distribution; only cells with >10,000 UMIs and <5% mitochondrial reads were included in the analysis (Supplementary Fig. 1a–c). In total, 5,014 cells derived from single transplanted Vwf-tdTomato+ P-HSCs or Vwf-tdTomato− multi-HSCs were sequenced. After filtering, 4,768 cells were included in the downstream analyses. Counts were normalized using the logNormCounts function from the scran package62. After normalization, a pseudocount of 1 was added, and the data were log2 transformed.
To identify HVGs, we used the modelGeneVar function from the scran package (Supplementary Fig. 1d). Batches were then integrated using a mutual nearest-neighbor approach (batchelor::fastMNN)24 by first performing a multisample principal component analysis (PCA) and then finding the mutual nearest neighbors in this PCA space. To visualize any potential technical batch effects from each sequencing run, we plotted the internal control LSK and GMP cells, as well as the cells isolated from transplanted mice, before and after batch correction on the PCA plots (Supplementary Fig. 1e,f) used to generate the tSNE and UMAP visualization plots. Batch integration performance was evaluated using the iLISI and cLISI metrics63 (Supplementary Fig. 1g). UMAP plots were generated using a range of HVGs (500–5,000 genes; Extended Data Fig. 4c) demonstrating a preserved pattern. The 2,000 most HVGs were selected for both UMAP and tSNE plots (Supplementary Fig. 2a–c and Extended Data Fig. 4c,d).
Cell-surface marker expression was extracted from FlowJo workspaces using flowWorkspace64 to parse the gating hierarchies. Cells lacking index-sorting information were assigned as nonindexed, and cells falling outside the defined gates were classified as nongated.
Gene signature analysis
Molecular signatures were computed using the rank-based AUC score implemented in the AUCell package65. HSCs and MkPs derived from Vwf-tdTomato+ P-HSCs and Vwf-tdTomato− multi-HSCs were compared based on their AUC scores for previously published signatures of lineage-restricted progenitors19 and cell-cycle status66 and for multiple HSC-associated signatures, including low-output HSC26, high-output HSC26, megakaryocyte-biased HSC26, multi-HSC26, HSC1 cluster26, serial-engrafter HSC26, LT-HSC21, stem score28, surface marker overlap25, MolO25, RA-CFP-dim HSC29 and dormant HSC versus active HSC27.
Differential gene expression analysis
Differential gene expression analysis was performed with a combination of the Wilcoxon test for differences in expression levels and Fisher’s exact test for expression frequencies, as previously described67. HSCs were defined as single cells with an AUCell score of >0.22 for the MolO signature25, and MkPs were defined as single cells with an AUCell score of >0.25 for the MkP signature19. Gene expression differences with an adjusted P value (combined Fisher) of <0.05 and an absolute value of log2(fold change) of >0.5 were considered significantly differentially expressed. Genes with one or more reads were classified as expressed within single cells. HALLMARK (v2023.2) gene-set enrichment analysis on the DEGs was performed by the preranked test in GSEA software version 4.3.3, using log2(fold changes) as the rank based on genes detected in more than ten cells.
Pseudotime analysis
Total counts were normalized, and committed erythroid and myeloid progenitor cells were excluded based on >2 log2(expression) values of Car1 and Mpo, shown to define committed erythroid and myeloid lineage progenitors19, respectively (Extended Data Fig. 4a,b). The cell-cycle phase effect in the progenitor compartment was removed while retaining the difference from quiescent stem cells by regressing the difference between the S-phase score and the G2M-phase score, as described in the Seurat package68. Variable features were selected, and batches were integrated as described above before dimensionality reduction with UMAP (Supplementary Fig. 2).
Pseudotime was computed using diffusion pseudotime69 with default parameters, implemented in the SCANPY70 package through the reticulate package in R. One cell with high expression of the MolO score (cell-id: AAGCCGTTGTCCATTG) was used as the starting cell. Differential gene expression analysis on the trajectories, with diffusion pseudotime as the independent variable, was performed using the tradeSeq package36. The filtered non-normalized count matrix was used as the input. Cells were assigned to either the P-HSC or multi-HSC trajectory with weight 1. Generalized additive models were fit with the default setting of six knots. Each gene was tested for differential expression as a function of pseudotime between P-HSC and multi-HSC using the patternTest function36. The genes were ordered according to their Wald statistic for downstream analysis and visualization. DEGs were identified within the top 70 genes when comparing cells replenished by Vwf-tdTomato+ P-HSCs and Vwf-tdTomato– multi-HSCs, sorted based on the Wald statistic with an adjusted P value of <0.01 and mean fold change of >1, and used to calculate the Pearson correlation between the two patterns. Correlation estimates and 95% CIs were calculated at 100 points along pseudotime. The same procedure was applied to the 70 most variable genes, representing randomly selected genes, to create a background correlation trajectory.
Reanalysis of MkPs produced by Hoxb5CreERT2-labeled HSCs in steady-state mice
A recent publication49 combined genetic fate mapping in Hoxb5CreERT2/+ R26Tom/+ reporter mice (a model for specific labeling of HSCs upon tamoxifen treatment) with single-cell RNA sequencing, in which the authors sequenced (Smart-seq2 or 10× single-cell RNA sequencing) HSPCs from steady-state Hoxb5CreERT2/+ R26Tom/+ mice at different time points following recombination induced by tamoxifen. We obtained the normalized gene expression (kindly provided by the authors) and compared molecularly defined MkPs replenished at early (days 3, 7 and 12) and late (days 112, 161 and 269) time points after tamoxifen for the expression of the most highly DEGs identified between MkPs derived from Vwf-tdTomato+ P-HSCs (P-MkPs) and from Vwf-tdTomato– multi-HSCs (multi-MkPs), focusing on genes with an absolute log2(fold change) value of >1 and a P value of <10−15 in the comparison between P-MkPs and multi-MkPs (Fig. 4a and Supplementary Table 4). Of the 30 genes meeting these criteria, genes not detected in the Hoxb5CreERT2 R26Tom/+ dataset were excluded, resulting in five and six genes upregulated and downregulated in P-MkPs, respectively, when compared to multi-MkPs. A one-tailed Wilcoxon test was used for the analysis, and multiple testing was adjusted using the Benjamini–Hochberg method.
In vivo Flt3Cre and VavCre fate mapping
Blood and BM samples were processed as described above and analyzed using LSRII and Fortessa cytometers (BD Biosciences). See Supplementary Table 5 for antibody details.
In 8- to 13-week-old Flt3Cretg/+ R26Tom/+ Vwf-eGFPtg/+ Gata1-eGFPtg/+ steady-state mice and in recipients of single HSCs, platelets and erythrocytes were gated based on the eGFP+ signal to exclude possible debris and to identify donor-derived cells, respectively. Leukocytes were gated CD41− in steady-state and CP- and 5FU-treated mice and Vwf/Gata1-eGFP− in single-HSC-transplanted mice (even if Gata1 is expressed in some myeloid cells17) to exclude transfer of the Flt3Cre-tdTomato signal from adhering platelets.
To exclude cases with inefficient Flt3Cre recombination, we checked the coexpression of cell-surface FLT3 and Flt3Cre-tdTomato in the BM of single-HSC transplantation donors. Steady-state Flt3Cre and VavCre mice were only used if erythroid, myeloid and B and T blood cells were ≥98% Flt3Cre-tdTomato+.
In vivo treatments
For CP treatment, 7- to 11-week-old Flt3Cretg/+ R26Tom/+ mice and 8- to 23-week-old VavCretg/+ R26Tom/+ mice received a single intraperitoneal injection of 200 mg kg−1 CP (European Pharmacopoeia, C3250000) or PBS control on day 0 (ref. 71). Blood was analyzed on days −3 (baseline), 4, 7, 18 and 45.
For 5FU treatment, 8- to 10-week-old Flt3Cretg/+ R26Tom/+ mice received a single intraperitoneal injection of 150 mg kg−1 5FU (Accord Healthcare) on day 0 (ref. 72). Blood was analyzed on days −7 or −2 (baseline), 5 (only blood cell counts), 10, 17 and 24. For both treatments, blood cell counts were measured with a Sysmex XP-300 automated cell counter, and peripheral blood and BM were processed as described above for transplantation experiments. CP and 5FU were obtained from the pharmacy at the Karolinska University Hospital.
For platelet depletion (anti-CD42b) treatment, 12- to 13-week-old Flt3Cretg/+ R26Tom/+ mice received a single intravenous injection of 2 mg kg−1 of an anti-CD42b antibody (R300, Emfret Analytics)73. Platelets and erythrocytes were processed as described above. For BM analysis, 11- to 12-week-old CD45.1 mice were compared on day 3 after anti-CD42b treatment to untreated CD45.1 mice. BM cell suspensions were prepared by crushing femurs, tibiae and pelvic bones from both legs of each treated and untreated mouse into PBS with 5% FCS and 2 mM EDTA. BM cells were incubated with fluorophore-conjugated CD16/32 for 15–20 min at 4 °C, followed by anti-mouse antibody staining for 15–20 min at 4 °C. BM cellularity and blood cell counts were measured with a Sysmex XP-300 automated cell counter. See Supplementary Table 5 for antibody details.
Analysis of reticulated platelets with TO
Platelet/erythrocyte cell suspensions, processed and antibody stained as described above, were incubated with 1 ml of BD Retic-COUNT reagent74 (BD Biosciences) or with 1 ml PBS with 5% FCS and 2 mM EDTA—samples and negative controls, respectively—for 1 h at room temperature in the dark (according to the manufacturer’s instructions, excluding fixation) and directly analyzed using Fortessa cytometers (BD Biosciences).
Data analysis
Statistical comparisons were performed as specified in the figure legends, using R scripts, GraphPad Prism 9 software and QuickCalcs online tools (https://www.graphpad.com/quickcalcs).
Kinetics, in which the blood of the same mouse was sampled at multiple time points (replenishment kinetics after transplantation, blood cell counts after CP treatment and Cre-driven tdTomato labeling after CP treatment), were analyzed with mixed-effects models using the lme4 R package. Mouse identity was assigned a random effect to account for intermouse variation. All combinations of time points and experimental conditions were assigned a fixed effect. Significance testing of all fixed-effects contrasts was done using the emmeans R package, and P values were adjusted using the Benjamini–Hochberg procedure.
Mixed-effects model analysis was also performed with a similar setup in the built-in statistical package of GraphPad Prism 9 for Cre-driven tdTomato labeling of reticulated platelets.
Flow cytometry data were acquired using BD FACSDiva version 9.0 software and analyzed using BD FlowJo version 10.8.1 software.
Reporting summary
Further information on research design is available in the Nature Portfolio Reporting Summary linked to this article.
- SEO Powered Content & PR Distribution. Get Amplified Today.
- PlatoData.Network Vertical Generative Ai. Empower Yourself. Access Here.
- PlatoAiStream. Web3 Intelligence. Knowledge Amplified. Access Here.
- PlatoESG. Carbon, CleanTech, Energy, Environment, Solar, Waste Management. Access Here.
- PlatoHealth. Biotech and Clinical Trials Intelligence. Access Here.
- Source: https://www.nature.com/articles/s41590-024-01845-6