Deletion of ABCA7 using CRISPR/Cas9 in human iPSC lines
Human iPSCs were generated from two healthy individuals (#1: MC0192; Female, 83 years old, APOE ε3/ε3 and #2: MC0117, Male, 71 years old, APOE ε3/ε3) and cultured in TeSR-E7 complete medium (Stemcell Technologies, Vancouver, Canada) on Matrigel (Corning, Corning, NY, USA) coated dish as reported previously [13]. The iPSCs were passaged with Dispase (Stemcell Technologies) every 6–9 days and subjected to treatment with ROCK inhibitor Y27632 (Sigma–Aldrich, Burlington, MA, USA) for the first 24 h. ABCA7 deletion was performed in the iPSC lines through CRISPR/Cas9 using two gRNA-Cas9 plasmids (sgRNA-1: AGCCTCGTACCAGTTGAGGGAGG and sgRNA-2: CACTGCTGCAGAGACCCCGAGGG) by ALSTEM. Karyotyping of the iPSC clones was performed by Mayo Clinic Cancer Center in Rochester.
Differentiation of iPSCs into cortical organoids
Cortical organoids were generated using the STEMdiff™ Cerebral Organoid Kit (Stemcell Technologies) according to the manufacturer’s instructions with minor modification [14, 15]. On day 0, iPSCs were dissociated into single-cell suspension with TrypLE Express (Thermo Fisher Scientific, Waltham, MA, USA) and cultured on U-bottom ultra-low-attachment 96-well plates (15,000 cells/well) in embryoid body (EB) formation media (medium A) supplemented with 10 μM Y27632. After the medium changes with EB formation media on day 2 and day 4, the iPSC-derived EBs were transferred onto 96-well low attachment plates on day 5 and cultured in the induction medium (medium B). On day 7, the EBs were transferred onto Matrigel-coated 6-well plates and cultured in the expansion medium (medium C + D) for cortical organoid formation for 3 days. On day 10, the culture medium was switched to the maturation medium (medium E). From day 10, the organoids were cultured on an orbital shaker followed by medium changes twice per week until day 60.
Differentiation of iPSCs into NPCs and neurons
The differentiation from iPSC lines into NPCs was performed using the STEMdiff™ SMADi Neural Induction Kit (Stemcell Technologies) according to the manufacturer’s instructions with minor modification [13]. On day 0, dissociated iPSCs (3.0 × 10⁶ cells/well) were transferred onto 24-well AggreWellTM800 plates (Stemcell Technologies) for EB formation and cultured in STEMdiff™ SMADi Neural Induction Medium (Stemcell Technologies) supplemented with 10 μM Y27632 for 8 days. Half of the medium in each well was changed every 2 days. On day 8, the iPSC-derived EBs were transferred onto a Matrigel-coated 6-well plate and cultured in the induction medium supplemented with 10 μM Y27632 for another 5 days to induce neural rosette formation in the attached EB colonies. On day 15, the neural rosettes were carefully isolated from the surrounding EB-derived flat cells. The small clumps of isolated neural rosettes were transferred onto Matrigel-coated plates and cultured in the induction medium for additional 5–7 days. After removal of cells with non-rosette morphology, the neural rosettes were dissociated into single cells with TrypLE Express and replated on the Matrigel-coated 24-well plate and cultured in the induction medium supplemented with 10 μM Y27632 to initiate the differentiation into NPCs. The culture medium was switched to STEMdiff™ SMADi Neural Progenitor Medium (Stemcell Technologies) 1 day after the replating. For NPC expansion, the cells were passaged every 5–7 days with daily medium change, followed by cryopreservation with STEMdiff™ Neural Progenitor Freezing Medium (Stemcell Technologies). NPCs with passage number between 3 and 7 were cultured on the Matrigel-coated 24-well plate in STEMdiff™ Forebrain Neuron Differentiation Medium (Stemcell Technologies) to be differentiated into NPCs. After 5–7 days, NPCs were dissociated with TrypLE Express and cultured on Poly-L-ornithine (PLO, Sigma)/Laminin (Sigma)-coated plates in the maturation medium supplemented with 10 μM Y27632 to be differentiated into neurons. Half of the medium in each well was changed twice per week until used for experiments.
Mice
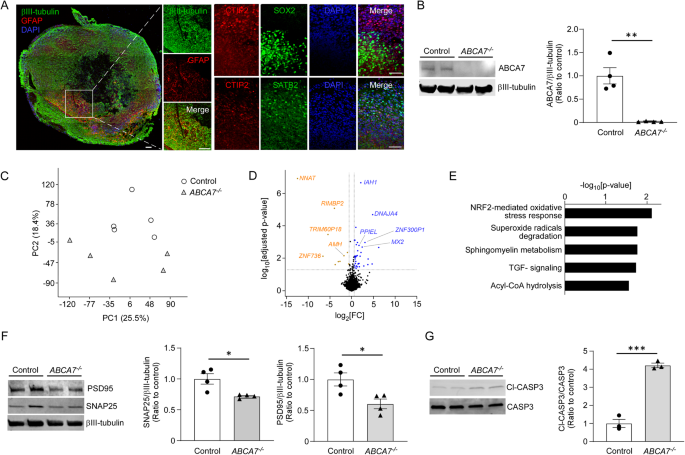
Abca7 floxed (Abca7floxp/floxp) mice were generated by Taconic Biosciences through a collaboration with the Cure Alzheimer’s Fund. Neuron-specific ABCA7 knockout (nABCA7−/−) mice were generated by breeding the Abca7floxp/floxp mice with Camk2a-Cre mice (EMMA: #01153, Munchen, Germany) [16, 17]. Male nABCA7−/− mice and control mice were analyzed at the age of 4 and 20 months. Frozen brain sections (20 µm thickness; coronal) were immunostained with the primary antibodies for ABCA7 (1:200, #25339-1-AP, Proteintech, Rosemont, IL, USA), NeuN (1:100, #MAB377, Millipore, Burlington, MA, USA), and GFAP (1:150, #ab279291, Abcam, Cambridge, UK) followed by incubations with the appropriate Alexa Fluor 488-, Alexa Fluor 568-, or Alexa Fluor 647-conjugated secondary antibodies (1:200, Thermo Fisher Scientific). Nuclei were then counterstained using DAPI (H-1500, Vector Laboratories, Newark, CA, USA). The images were taken with confocal laser scanning fluorescent microscopy (model LSM880 Invert, Carl Zeiss, Baden-Wurttemberg, Germany). Synaptosomes were isolated from the whole mouse brain using Syn-PERTM Synaptic Protein Extraction Reagent (Thermo Fisher Scientific) according to the manufacturer’s instructions. Briefly, the brain samples were homogenized in Syn-PER Reagent with Protease and Phosphatase inhibitor Cocktail (Thermo Fisher Scientific). The samples were centrifuged at 1200 g for 10 min and the remaining supernatants were transferred. The supernatants were then centrifuged at 15,000 g for 20 min, and the pellets (synaptosomes) were resuspended with Syn-PER Reagent with Protease and Phosphatase inhibitor Cocktail.
Immunocytochemistry and staining for mitochondria and ER
The cells were immunostained with primary antibodies against TRA-1-60 (1:200, #ab16288, Abcam), NANOG (1:200, #D7364, Cell Signaling, Beverly, MA, USA), βIII-tubulin (1:500, #ab78078, Abcam; or 1:1000, #T2200, Sigma), MAP2 (1:200, #ab183830, Abcam), GFAP (1:100, #ab279291, Abcam), CTIP2 (1:50, #ab18465, Abcam), SATB2 (1:100, #ab34735, Abcam), SOX2 (1:250, #ab18102, Abcam), Nestin (1:500; #ab97959, Abcam), ABCA7 (1:500, #sc-377335, Santa Cruz Biotechnology, Dallas, TX, USA), and/or calreticulin (1:400, #12238, Cell Signaling) as previously described [18], followed by incubations with the appropriate Alexa Fluor 488- or Alexa Fluor 568-conjugated secondary antibodies (Thermo Fisher Scientific) and nuclei counterstaining with DAPI (300 nM, #D1306, Thermo Fisher Scientific). The level of reactive oxygen species (ROS) was analyzed as described previously [19]. Briefly, mitochondrial superoxide was quantified by staining with 10 μM MitoSOX red (Thermo Fisher Scientific) for 30 min. Mitochondria were stained with 200 nM MitoTracker Green FM (Thermo Fisher Scientific) for 30 min.
The MitoSOX/MitoTracker signal ratio was used to analyze the ROS level per mitochondria. The iPSC-derived neurons were incubated with 5 µM of NBD-PA_16:0-06:0 (1-palmitoyl-2-{6-[(7-nitro-2-1,3-benzoxadiazol-4-yl)amino]hexanoyl}-sn-glycero-3-phosphate) (#810173, Avanti Polar Lipids, Alabaster, AL, USA) and 1 µM of ER tracker (#E34250, Thermo Fisher Scientific) for 30 min. All images were taken with confocal laser scanning fluorescent microscopy (model LSM880 Invert, Carl Zeiss). The fluorescence of MitoSOX and MitoTracker were measured using SpectraMax M5 (Molecular Devices, San Jose, CA, USA). The mean fluorescence intensity of ER tracker or NBD PA co-localized with ER tracker were measured with ImageJ.
Transmission electron microscopy (TEM)
The iPSC-derived cortical organoids, neurons, and mouse synaptosomes were fixed with PBS containing 2% glutaraldehyde and 2% PFA, followed by post-fixation with 1% OsO4. The samples were stained with 1% uranyl acetate in 50% ethanol for 30 min, then sequentially dehydrated with increased concentrations of ethanol (70%, 80%, 95%, and 100%) and at last 100% propylene oxide for 10 min each time. After the dehydration, samples were infiltrated with the 1:1 mixture of 100% propylene oxide and Epon 812 (Polysciences, Warrington, PA, USA) overnight at room temperature, then embedded in Epon 812, followed by polymerization at 60 °C for 2 days. Ultrathin sections (100 nm) were sliced from the Epon 812 embedded samples by Leica Ultramicrotome (UC7), and subsequently counterstained with uranyl acetate and lead citrate. The sections were imaged using JEM-1400 Flash Transmission Electron Microscopy (JEOL). Mitochondrial morphology (length, width, perimeter, and circularity) was measured with ImageJ [20].
qRT-PCR
Total RNA was isolated from iPSCs, iPSC-derived cortical organoids, and mouse brains with RNeasy® Mini Kit (Qiagen, Hilden, Germany). Reverse transcription was performed using SuperScript® III First-Strand Synthesis System (Thermo Fisher Scientific). The qRT-PCR was performed using SsoAdvanced Universal SYBR® Green Supermix (Bio-Rad, Hercules, CA, USA) or TaqMan™ Gene Expression Master Mix (Thermo Fisher Scientific) using Quantstudio 7 (Thermo Fisher Scientific). Gene-expression levels were normalized to GAPDH or Gapdh expression. All primers were purchased from IDT, Inc. and Thermo Fisher Scientific: (Supplementary Table 1).
Western blotting
Samples were lysed with RIPA Buffer (Boston BioProducts, Inc., Milford, MA, USA) containing Protease and Phosphatase Inhibitor Cocktail (Thermo Fisher Scientific) and subjected to Western blotting [14, 15]. Anti-ATP5A (1:500, #ab110413, Abcam), anti-β-actin (1:3000, #A2228, Millipore), anti-caspase-3 (1:1000, #9662, Cell Signaling Technology), anti-cleaved caspase-3 (1:1000, #9662, Cell Signaling Technology), anti-ABCA7 (1:500, #sc-377335, Santa Cruz Biotechnology), anti-ABCA7 (1:500, #MABI 97-17, MAB Institute, Kanagawa, Japan), anti-βIII-tubulin (1:1000, #ab78078, Abcam), anti-PSD95 (1:1000, #ab18258, Abcam), anti-SNAP25 (1:1000, #PA5-85396, Thermo Fisher Scientific), anti-TIM23 (1:100, #sc-514463, Santa Cruz Biotechnology), anti-MFN2 (1:1000, #ab56889, Abcam), ant-DRP1 (1:500, #ab184247, Abcam), and anti-FIS1 (1:500, #PA5-22142, Thermo Fisher Scientific) were used as primary antibodies. The following secondary antibodies were used: IRDye®800CW Goat anti-Mouse and anti-Rat (1:4000, #926-32210 and #926-32219, LI-COR Biosciences, Lincoln, NE) and IRDye®680RD Goat anti-Rabbit (1:4000, #926-32211, LI-COR Biosciences). Immunoreactivities were detected and quantified using Odyssey Infrared Imaging System (LI-COR Biosciences).
Measurement of ATP synthase activity and advanced oxidation protein product (AOPP) levels
ATP synthase activity was measured using ATP Synthase Enzyme Activity Microplate Assay Kit (Abcam) according to the manufacturer’s instructions. The absorbance of the product was measured at 340 nm using SynergyTM HT Microplate Reader (BioTek, Winooski, VT, USA). AOPP levels were measured using the AOPP Assay Kit (Abcam) according to the manufacturer’s instructions. The absorbance of the product was measured at 340 nm using SynergyTM HT Microplate Reader (BioTek).
Microelectrode array (MEA) electrophysiology
The iPSC-derived NPCs were cultured on the Matrigel-coated 24-well plate with STEMdiff™ Forebrain Neuron Differentiation Medium (Stemcell Technologies) for 5–7 days. The NPCs dissociated with TrypLE Express were transferred onto Poly-ethyleneimine (PEI, Sigma)/Laminin (Sigma)-coated MEA 24-well Plate-eco (1 × 10⁵ cells/well) and to differentiated into neurons in STEMdiff™ Forebrain Neuron Maturation (Stemcell Technologies) supplemented with 10 μM Y27632. Spontaneous spikes were recorded for 10 min with MED64 Presto (Alpha Med Scientific, Osaka, Japan) weekly from 2 weeks after the differentiation. A spike was detected when the recorded signal exceeded a threshold of ±5 σ, where σ was the standard deviation of the baseline noise during quiescent periods. Burst firing was detected as the group of spikes with less than the average inter-spike interval (ISI), and the burst duration time was decided using Poisson surprise [21]. The recorded spikes and burst firing were analyzed with MEA Symphony and Burst Analysis Table software (Alpha Med Scientific).
Oxygen consumption rate (OCR) measurement
iPSCs, iPSC-derived NPCs, or neurons were plated on Matrigel or Poly-L-ornithine (PLO, Sigma)/Laminin (Sigma)-coated Seahorse XF96 Cell Culture Microplate (Agilent, Santa Clara, CA, USA). The iPSC-derived neurons were cultured for 6 weeks, and then Oxygen Consumption Rate (OCR) values were measured using Seahorse XFe96 Extracellular Flux Analyzer (Agilent) in accordance with the manufacturer’s instructions in the XF Cell Mito Stress Test Kit (Agilent). OCR at the iPSC and NPC stages, cells were measured 1 day after the plating. Oligomycin (1.5 μM for iPSCs and 2.5 µM for NPCs/neurons), FCCP (0.5 μM for iPSCs and 1 μM for NPCs/neurons), and rotenone/antimycin A (0.5 μM) were used. After OCR was measured, the cells were fixed with PBS containing 4% PFA, stained with DAPI (Thermo Fisher Scientific), and the fluorescence intensity was measured using SpectraMax M5 (Molecular Devices) to assess the cell density. OCR in each well was normalized by the cell density.
Administrations with nicotinamide mononucleotide (NMN), phosphatidylglycerol (PG), cardiolipin (CL), and phosphatidic acid (PA)
NMN (#S5259, Selleck Chemicals LLC, Houston, TX, USA) was dissolved in deuterium-depleted water (DDW) at 100 mM as a stock solution. PG_18;2-18:2 (1,2-dilinoleoyl-sn-glycero-3-phospho-(1′-rac-glycerol); #840485, Avanti Polar Lipids), CL (bovine heart-derived cardiolipin (#840012, Avanti Polar Lipids)), and PA (chicken egg-derived L-α-phosphatidic acid; #840101, Avanti Polar Lipids) were dissolved in dimethyl sulfoxide (DMSO) at 50, 25, and 25 mM, respectively, as a stock solution. In all experiments, culture medium containing DDW or DMSO (0.1–0.2 %) was used as respective controls. The concentrations of NMN, PG, CL, and PA were selected based on their relevance in previous reports [22,23,24,25].
RNA-seq
RNA-seq was performed at Mayo Clinic sequencing core using Illumina HiSeq 4000 as described previously [14, 15]. Reads were aligned to the human reference genome hg38. Mayo Clinic RNA-Seq analytic pipeline (MAP-RSeq Version 3.1.3) was used [26] to generate raw gene read counts and sequencing quality control metrics. Raw gene counts were corrected for gene length differences, GC bias, and global technical variations through Conditional Quantile Normalization (CQN) [27]. Based on the bi-modal distribution of the CQN normalized and log2-transformed reads per kb per million (RPKM) gene-expression values, genes with an average of log2 RPKM ≥ 0 in at least one genotype group were included in the analysis. Using this threshold, 17,912 genes were identified for downstream analysis. PCA and differentially expressed genes (DEG) analysis were performed using Partek Genomics Suite (Partek Inc., St. Louis, MO, USA). An ANOVA model was used to compare gene expressions between ABCA7−/− iPSC-derived cortical organoids and isogenic controls while adjusting for the confounding effects of RNA Integrity Numbers (RIN). Volcano plots of differentially expressed genes were generated using R version 3.4.1. Pathway analyses of differentially expressed genes were performed using Ingenuity Pathway Analysis (QIAGEN) [28].
Lipidomics
Shotgun lipidomic analysis was conducted through the multidimensional mass spectrometry system as described previously [15]. Samples were homogenized with Precellys Lysing Kit (Bertin Instruments, Montigny-le-Bretonneux, France) using Cryolys Evolution homogenizer (Bertin Instruments) and subjected to lipid extraction through modified Bligh and Dyer procedure [29]. Each lipid extract was reconstituted in organic solvent composed of chloroform and methanol (1:1 volume ratio, 400 µl/mg protein) and diluted to a final total lipid concentration of ~500 fmol/µl. Mass spectrometric analysis was performed on a triple quadrupole mass spectrometer (TSQ Altis, Thermo Fisher Scientific) and a Q Exactive mass spectrometer (Thermo Fisher Scientific), which were connected with an automated nanospray device (TriVersa NanoMate, Advion Inc, Ithaca, NY, USA) [30]. Amounts of lipid species were normalized to the protein concentrations [31, 32]. For WGCNA in the lipidomics data, a power of 12, a minimum module size of 10 lipids, and a minimum height for merging modules of 0.25 were employed to construct an unsigned network. Modules were annotated through R package anRichment. Hub lipids were defined based on the connectivity in each module.
Statistical analysis
All statistical analyses were performed using EZR software and GraphPad Prism 9 except for RNA-seq and lipidomics. Comparisons were performed using two-tailed student’s t-test, paired t-test, Tukey–Kramer post hoc analysis of Two-way ANOVA, or repeated measures two-way ANOVA. P values < 0.05 were considered statistically significant.
- SEO Powered Content & PR Distribution. Get Amplified Today.
- PlatoData.Network Vertical Generative Ai. Empower Yourself. Access Here.
- PlatoAiStream. Web3 Intelligence. Knowledge Amplified. Access Here.
- PlatoESG. Carbon, CleanTech, Energy, Environment, Solar, Waste Management. Access Here.
- PlatoHealth. Biotech and Clinical Trials Intelligence. Access Here.
- Source: https://www.nature.com/articles/s41380-023-02372-w