Twenty-two patients were included in this analysis, 9 who were enrolled in the ABA2 trial and 13 who were “off-study” patients. Median age at HCT was 66 years (range 60-76 years). The most common indication for transplant was MDS followed by AML (68% and 23% respectively). 32% of patients had high or very high DRI and 50% of the patients had >=3 HCT-CI. 90% of patients received reduced intensity conditioning with fludarabine/melphalan and 10% received myeloablative conditioning with busulfan/cyclophosphamide. 86% of patients received peripheral blood stem cell grafts. 68% of donors were younger than 35 years. Median follow-up for survivors was 2 years.
There was one death prior to day 30, but all other patients achieved neutrophil engraftment by day 30 and platelet engraftment by day 100. The cumulative incidence of grade II–IV aGVHD by day 180 was 18% (95% confidence interval, CI, 6–37%, Fig. 1a) and the cumulative incidence of grade III–IV aGVHD by day 180 was 5% (95% CI 0.3–19%, Fig. 1b). One patient developed grade II late aGVHD at day +264. The cumulative incidence of moderate-severe chronic GVHD (cGVHD) at 1 year was 62% (95% CI 37–80%). The cumulative incidence of TRM and relapse at 1 year was 23% (95% CI 8–42%, Fig. 1c) and 5% (95% CI 0.3–20%) respectively, resulting in DFS of 73% (95% CI 49–87%), and OS of 77% (95% CI 54–90%). GRFS at 1 year was 59% (95% CI 36–76%, Fig. 1D). With respect to HCT-CI of <3 vs >=3, there were no statistically significant differences in TRM (18% vs 27%, p value = 0.62), OS (82% vs 73%, p = 0.62) and DFS (82% vs 64%, p = 0.35, Fig. 1e) between the two groups. There were also no statistically significant differences in TRM (20% vs 29%, p = 0.67), OS (80% vs 71%, p = 0.67) and DFS (80% vs 57%, p = 0.26%, Fig. 1f) between low and intermediate DRI vs high and very high DRI respectively.
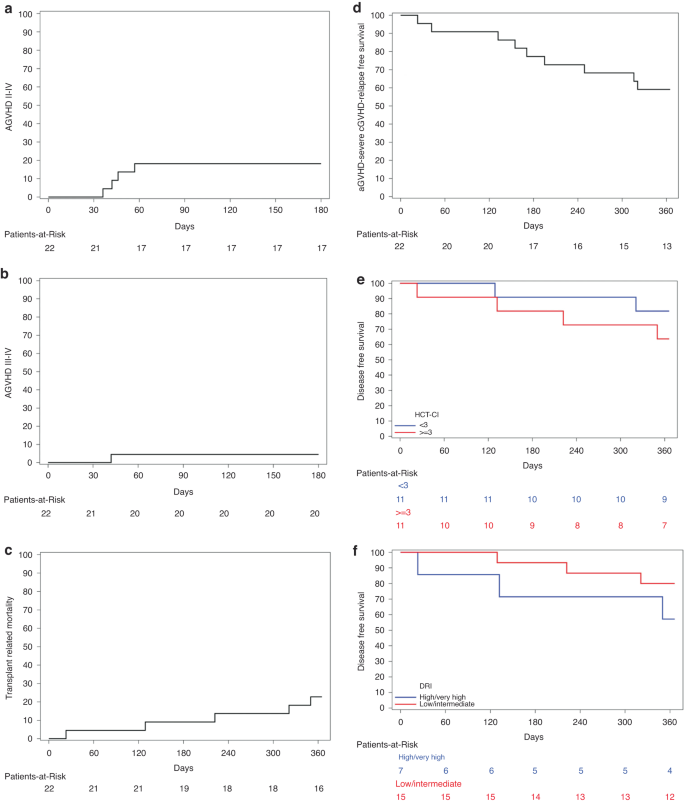
a Cumulative incidence of Grade 2–4 aGVHD. b Cumulative incidence of Grade 3–4 aGVHD. c Cumulative incidence of Transplant Related Mortality. d Kaplan-Meier plot of Grade III–IV acute GVHD-free, severe chronic GVHD-free, elapse-free survival (e). Kaplan-Meier plot of Disease-Free Survival based on Transplant Comorbidity Index (HCT-CI) of <3 vs >=3. f Kaplan-Meier plot of Disease-Free Survival based on Disease Risk Index (DRI), low and intermediate DRI vs high and very high DRI.
- SEO Powered Content & PR Distribution. Get Amplified Today.
- PlatoData.Network Vertical Generative Ai. Empower Yourself. Access Here.
- PlatoAiStream. Web3 Intelligence. Knowledge Amplified. Access Here.
- PlatoESG. Automotive / EVs, Carbon, CleanTech, Energy, Environment, Solar, Waste Management. Access Here.
- PlatoHealth. Biotech and Clinical Trials Intelligence. Access Here.
- ChartPrime. Elevate your Trading Game with ChartPrime. Access Here.
- BlockOffsets. Modernizing Environmental Offset Ownership. Access Here.
- Source: https://www.nature.com/articles/s41409-023-02043-y