Culturing and maintenance of iPSCs
hiPSCs (gifts from Jiangsu University) were maintained on Matrix511-silk (Nippi 38710131) coated tissue culture plates in StemFit Basic04 medium (AJINOMOTO, Basic04CT). Cells were dissociated for passaging with Accutase (Stemcell, 07922).
Human umbilical vein endothelial cells
Human umbilical vein endothelial cells (HUVECs, gifted from Jiangsu University) were cultured on gelatin coated plates in EGM2 (Lonza CC-3162) medium, which was refreshed every 1–2 days. Cells were used between passages 3–4.
hiPSC differentiation into iEPCs
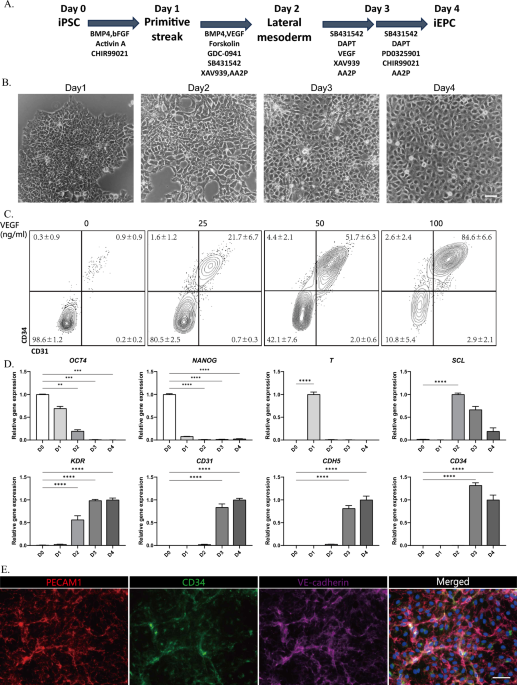
hiPSCs were differentiated into iEPCs in serum-free medium (SFM) as described below. The composition of SFM: 50% IMDM (GIBCO, 12440053), 50% Ham’s F-12 K (GIBCO, 21127022), 1 mg/ml polyvinyl alcohol (Sigma, P8136-250G), 1% N2 (GIBCO, 17502048), 1% B27 (GIBCO, 17504044), 450 mM 1-thioglycerol (Sigma, M6145-100ML), 1% GlutaMAX (GIBCO, 35050061), and 0.1% ITS-X (GIBCO, 51500056). Day 0 hiPSCs were dissociated into single cells (Accutase) and plated into a 24-well plate in StemFit04 supplemented with Y-27632 (1 μM, Selleck) and Matrix511-silk (0.5 μl/cm2) at 20,000 hiPSCs/cm2. After 24 h, the medium was replaced with SFM supplemented with Activin A (30 ng/ml, R&D Systems), BMP4 (40 ng/ml, R&D Systems), CHIR99021 (6 μM, Tocris), or FGF2 (20 ng/ml, R&D Systems), and the cells were cultured for 24 h. Day 1 middle primitive streak cells were differentiated toward the lateral mesoderm in SFM supplemented with BMP4 (40 ng/ml), GDC-0941 (2.5 μM, Selleck), forskolin (10 μM, Tocris), SB-431542 (6 μM, Selleck), VEGF (100 ng/ml, R&D Systems), XAV939 (1 μM, Selleck) and ascorbic acid-2-phosphate (AA2P; 200 μg/ml, Sigma) for 24 h. On day 2, lateral mesoderm cells were differentiated in SFM supplemented with SB-431542 (6 μM), DMH1 (250 nM, Selleck), DAPT (10 μM, Selleck), VEGF (100 ng/ml), XAV939 (1 μM) and AA2P (200 μg/ml) for 24 h. Subsequently, day 3 cells were differentiated in SFM medium supplemented with SB431542 (6 μM), DAPT (10 μM), PD0325901 (500 nM, Selleck), CHIR99021 (1 μM) and ascorbic acid-2-phosphate (AA2P; 200 μg/ml) for 24 h, after which iEPCs were obtained on day 4.
iEPCs differentiation into LSEC-like cells
On days 5–8, iEPCs were further differentiated into LSEC-like cells in LSEC induction medium (LIM) as described below. The composition of LIM included EGM2 (50% v/v), StemPro™-34 SFM (50% v/v, GIBCO) supplemented with 1 mg/ml polyvinyl alcohol, SB-431542 (6 μM), FGF2 (20 ng/ml), and 8-Br-cAMP (0.2 mM, Selleck). The LIM was replaced every 2 days.
Differentiation medium A consisting of 25% StemPro™-34 SFM, 75% IMDM supplemented with 0.1% ITS-X, 1% GlutaMAX, 1-thioglycerol (450 mM), ascorbic acid-2-phosphate (AA2P; 50 μg/ml), bFGF (20 ng/ml), 8-Br-cAMP (0.2 mM) and SB-431542 (6 µM); Differentiation medium B consisting of EGM-2 supplemented with VEGF (50 ng/ml) and A83-01 (1.5 µM); differentiation medium C was LSEC induction medium (LIM).
In this study, LSECs were induced under hypoxic conditions (5% CO2, 5% O2, 90% N2, 37 °C). All other cells were cultured under normoxic conditions (5% CO2, 95% air, 37 °C).
MACS and FACS
Differentiated cells were dissociated by incubation in TrypLE Express (Gibco, 12604021) for 5 min at 37 °C. Subsequently, the dissociated cells were mixed at a ratio of 1:5–1:10 in DMEM/F12 and centrifuged (pelleted) at 300 × g for 5 min. Each cell pellet was resuspended in PBS and 2% v/v FBS (GIBCO, 10091148). EPCs were purified based on CD34 expression using mouse anti-human CD34 antibody-conjugated magnetic beads according to the manufacturer’s instructions (Miltenyi, 130046702). For FACS, the following primary antibodies were used for flow cytometric staining: anti-CD34-APC (BD Biosciences, 555824), anti-CD34-BV421 (BD Biosciences, 562577), anti-CD309-Alexa647 (BD Biosciences, 560871), anti-CD31-APC (BD Biosciences, 555445), and anti-LYVE-1-APC (R&D Systems, FAB2089). Flow cytometry was performed using a CytoFLEX (Beckman Coulter). The data were analyzed using FlowJo software (version 10.6.2).
Quantitative PCR
The RNA isolation utilized TRIzol™ Reagent (Invitrogen, 15596018CN), and up to 1 mg of RNA was subsequently reverse transcribed into cDNA with a RevertAid First Strand cDNA Synthesis Kit (ThermoFisher, K1622). Quantitative PCR (qPCR) was conducted on a LightCycler 480 machine (Roche) using TB Green Premix Ex Taq (Takara, RR420A) along with gene-specific forward and reverse primers. The sequences of the qPCR primers used can be found in Supplementary Table 1. The expression levels of the target genes were normalized to that of the reference gene GAPDH.
Immunofluorescence
The cells were fixed using a methanol and acetone mixture (1:1) at 4 °C for 30 min, followed by blocking in 10% (v/v) normal donkey serum in PBS for 1 h. Primary antibodies against CD31 (1:200, Cell Signaling, 3528S), CD34 (1:200, Abcam, ab81289), VE-cadherin (1:200, R&D Systems, AF938-SP), and LYVE1 (1:1000, Abcam, ab36993) were incubated overnight at 4 °C. Subsequently, secondary antibodies, including CyTM5-conjugated donkey anti-goat (1:500, Jackson, 70575147), CyTM3-conjugated donkey anti-mouse (1:500, Jackson, 715165150) and Alexa Fluor-488-conjugated donkey anti-rabbit (1:500, Invitrogen, A-21206), were applied for 60 min. Following nuclear staining with 4′,6-diamidino-2-phenylindole (DAPI) for 1–2 min at room temperature, the cells were washed three times. Fluorescently stained samples were imaged using a Revolve (ECHO) imaging system. Image processing was conducted using Image-Pro Plus (V 6.0).
Cellular acetylated ac-LDL uptake and IgG endocytosis ability
The cells were cultured in LIM medium supplemented with 4 μg/ml Dil-acLDL (Yeasen Biotechnology, 20606ES76) for LDL uptake evaluation or 30 μg/mL Cy5-conjugated donkey anti-goat for immune complex endocytosis evaluation at 37 °C for 4 h. Then, the cells were incubated with 5 μg/ml Hoechst 33342 (Sigma, B2261) at 37 °C for 20 min after being washed with DMEM/F12, and the cells were analyzed under a Revolve (ECHO) fluorescence microscope. Images were processed for analysis using Image-Pro Plus.
Single-cell RNA sequencing
Three liver single-cell sequencing datasets, GSE158723, GSE115469 and GSE124395; vascular endothelial cell data GSE135202 and GSE233130, were selected from the GEO database as the datasets for preliminary analysis30,35,36. The Seurat package was used to preprocess the data for each of these three datasets. Remove batch effects using the Harmony package. Plotting with the R package ggplot2.
Bulk RNA sequencing
We conducted the data analysis using R software (version 4.2.2). The raw sequencing data were derived from our laboratory-generated datasets and the publicly available GEO database, encompassing the GSE 119378 dataset. Initially, data curation and preprocessing were performed using the tidyverse package (version 1.4.2.0). The DESeq2 package (version 1.4.2.0) was employed for the identification of DEGs and correction for batch effects. We established a significance threshold of p < 0.05 and a minimum fold change of 2 for the differential expression. Functional enrichment analysis of DEGs was performed using the clusterProfiler package (version 4.1.0). The enrichGO function was used for Gene Ontology (GO) enrichment analysis, and the enrichKEGG function was applied for the enrichment analysis of KEGG pathways, aiming to identify biological processes. The visualization of DEGs was facilitated by the ggplot2 package (version 3.4.4), which was used to construct bar graphs and principal component analysis (PCA) plots to intuitively display variations in gene expression. Additionally, the heatmap package (version 1.0.12) was utilized to produce heatmaps, illustrating the clustering of gene expression levels.
Statistical analysis
Apart from bulk and scRNAseq experiments, all data are expressed as the mean ± standard deviation (SD) and were analyzed using Prism 9 (GraphPad) via one-way or two-way ANOVA with Bonferroni post hoc analysis. Significant differences were determined by Student’s two-tailed t test or Welch’s two-tailed t test depending on scedasticity. The results were considered to be significant at *p < 0.05, **p < 0.01, ***p < 0.001 and ****p < 0.0001.
- SEO Powered Content & PR Distribution. Get Amplified Today.
- PlatoData.Network Vertical Generative Ai. Empower Yourself. Access Here.
- PlatoAiStream. Web3 Intelligence. Knowledge Amplified. Access Here.
- PlatoESG. Carbon, CleanTech, Energy, Environment, Solar, Waste Management. Access Here.
- PlatoHealth. Biotech and Clinical Trials Intelligence. Access Here.
- Source: https://www.nature.com/articles/s41598-024-64195-1