Acbp6, an integrative metabolic regulatory hub, was generated by gene expansion in the Drosophila genus with specialized expression in the midgut
In order to identify unique metabolic pathways or networks that could act as integrative regulatory nodes in tissue plasticity, we employed a small-scale meta-analysis of accessible Drosophila melanogaster transcriptomes. These transcriptomes highlight global gene expression changes in response to internal (such as aging) or external (such as infection) cues that are known to induce general tissue remodeling44,45,46,47,48. Exploiting these datasets, we found acyl-CoA binding-protein 6 (Acbp6) expression to be uniquely regulated in response to all of these stimuli (Supplementary Fig. 1a). Moreover, whole-genome expression analyses in Drosophila have also uncovered changes in Acbp6 expression in response to starvation and high-sugar diet treatment49, suggesting that Acbp6 is regulated by dietary and/or nutritional cues. Acbp6 is part of a family of proteins with evolutionarily conserved ACB (acyl-CoA binding) domains, allowing for acyl-CoA binding and transport31. After exploring genomic sequences across insecta orders, we found that species within the Drosophila genus have more Acbp genes compared to other insects (Fig. 1a and Supplementary Fig. 1b). Eight Acbp genes were identified in Drosophila melanogaster, and phylogenetic analysis revealed that Acbp genes underwent a remarkable extension during evolution (Fig. 1a). Moreover, Acbp6 is tandemly arrayed with Acbp2, Acbp3 and Acbp4 within the Drosophila melanogaster genome. The expansion of the Acbp gene family in Drosophila also underlies specialized gene expression. Using available expression data resources for flies, we learned that Acbps expression is divergent, as Acbp1, Acbp2, Anox, and CG8814 are widely-expressed across tissues, while Acbp3, Acbp4, Acbp5, and Acbp6 are specifically expressed in the adult fly midgut and hindgut (Fig. 1b). The midgut, part of the larger gastrointestinal tract, is the major site of food digestion, nutrient absorption, and energy substrate storage, and to this end displays a high degree of plasticity in response to nutritional changes5,50. Combined with the phylogenetic evidence, these analyses suggest that Acbp6 may represent a key metabolic regulatory node in the evolution of nutrient adaptation.
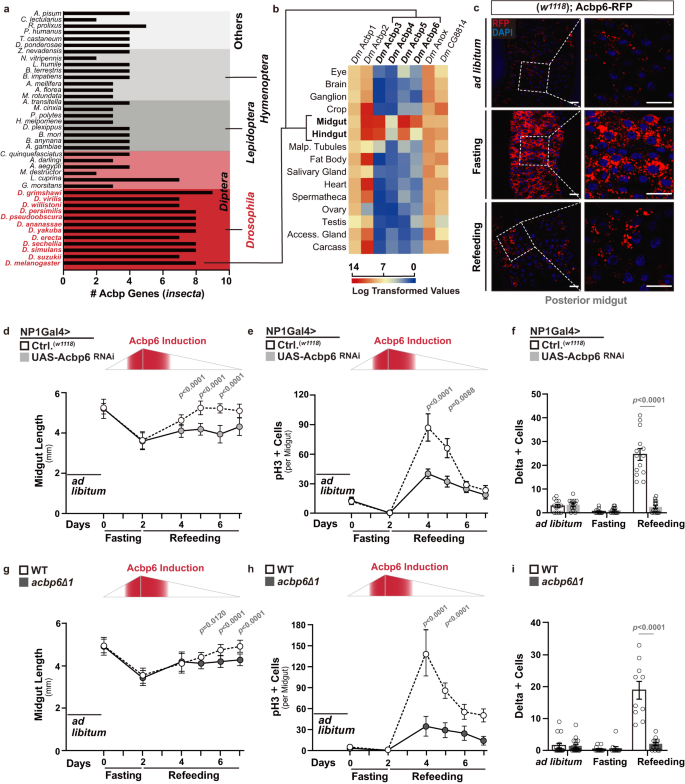
a Histogram depicting the number of Acbp genes per genome of various insects. Left y-axis label displays species, right y-axis label displays orders. b Expression pattern of Drosophila melanogaster Acbp genes in different adult tissues; log transformed values from modEncode datasets. c Acbp6 expression pattern in dissected posterior midguts from w1118; Acbp6-RFP/Acbp6-RFP transgenic flies during nutrient adaptation; stained with DAPI (blue); RFP (red) (n = 3 independent experiments). d–f Quantification of d midgut length (from left to right, bars represent n = 14, 15, 16, 14, 15, 18, 19, 17, 13, 20, 15, and 20 independent samples), e phospho-Histone (H3) positive cells (per whole dissected midgut, from left to right, bars represent n = 13, 13, 14, 14, 10, 19, 14, 10, 23, 14, 17, and 18 independent samples), and f Delta positive cells (per field, posterior midgut) upon enterocyte-specific depletion of Acbp6 during nutrient adaptation (from left to right, bars represent n = 12, 13, 12, 13, 14, and 14 independent samples). Genotypes; w1118; NP1Gal4/+ (controls, Ctrl.), w1118; NP1Gal4/UAS-Acbp6 RNAi. g–i Quantification of g midgut length (from left to right, bars represent n = 30, 28, 30, 34, 29, 35, 17, 23, 22, 15, 18, and 16 independent samples), h phospho-Histone (H3) positive cells (per whole dissected midgut, from left to right, bars represent n = 11, 11, 11, 11, 11, 11, 19, 15, 17, 18, 13, and 11 independent samples), and i Delta positive cells (per field, posterior midgut) in acbp6 mutant flies (acbp6Δ1) or controls (wild-type, WT; revertant) during nutrient adaptation (from left to right, bars represent n = 16, 17, 12, 11, 10, and 14 independent samples). Bars represent mean ± SEM (unpaired 2-tailed Student’s t-test) d–i. The exact p values are provided in figure. Source data are provided as a Source Data file. Fasting represents 2 days of nutrient deprivation, and Refeeding represents 2 days of refeeding unless otherwise indicated. Diagram in panels d, e, g, and h represent an Acbp6 reporter induction strength timeline. Scale bars, 10 μm.
Acbp6 distinctly regulates midgut tissue plasticity during nutrition adaptation by adjusting proliferative homeostasis
In order to further explore Acbp6 expression/regulation in the Drosophila midgut during nutrient adaptation, we generated an in vivo expression reporter (using a 1,000 base pair promoter region upstream of Acbp6 transcription start site, linked to red fluorescent protein [RFP]; Acbp6-RFP). Acbp6-RFP reporter activity is relatively low when flies are fed ad libitum (Fig. 1c). However, RFP intensity in the posterior midgut is increased in response to nutrient deprivation (2 days fasting), and subsequently normalized by refeeding (2 days, Fig. 1c, Supplementary Fig. 2a). Acbp6 reporter activity is mainly restricted to the large, polyploid cells of the midgut epithelium (functionally differentiated enterocytes; NP1Gal4, UAS-nlsGFP+ cells, ECs, Supplementary Fig. 2b), which project microvilli into the lumen and drive nutrient absorption. This nutrient-dependent pattern of Acpb6-RFP reporter activity is specific to the posterior midgut, the region where the intestinal stem cells are most active during regeneration, as reporter activity does not change in the anterior or middle midgut, the other regions that display Acbp6-RFP reporter activity (Supplementary Fig. 2a–d). To confirm reporter accuracy, we monitored Acbp6 transcription in dissected posterior midguts (via qRT-PCR) during fasting-refeeding transitions, and again found that Acbp6 transcript is induced during fasting and normalized upon refeeding (Supplementary Fig. 2e). Finally, we generated an Acbp6P-ACBP6V5 transgenic fly expressing a C-terminal V5-tagged ACBP6 protein under the control of an Acbp6 promoter/enhancer region (Acbp6P, similar to the RFP reporter). Immunostaining confirmed that ACBP6-V5 protein level is up-regulated during fasting (with localization in the cytoplasm of posterior midgut enterocytes) and normalized upon refeeding (Supplementary Fig. 2f, g). Altogether, these data provide evidence that Acbp6 is dynamically regulated during nutrient adaptation.
To determine if Acbp6 and potentially acyl-CoA metabolism play a role in nutrient-dependent tissue plasticity, we monitored midgut size during these nutrient adaptive responses (fasting-refeeding transitions). The adult Drosophila midgut is extremely malleable, and can shrink and regrow/remodel (tissue resizing) in response to external cues, including nutrient fluctuations or dietary changes2,7. In control flies, we found that the midgut dramatically shrinks in response to nutrient deprivation (reducing length by approximately 30% after 2 days fasting), but resizes, back to normal length, 3–4 days after refeeding (Fig. 1d and Supplementary Fig. 3a, b). However, attenuating Acbp6 in enterocytes utilizing RNAi (NP1Gal4>UAS-Acbp6RNAi) limits midgut resizing only during refeeding (Fig. 1d and Supplementary Fig. 3a–c), suggesting Acbp6 plays a key role in midgut plasticity during nutrient adaptation.
The midgut epithelial layer mainly contains four types of cells: intestinal stem cells (ISCs), enterocytes, secretory enteroendocrine cells (EEs), and enteroblasts (EBs, a postmitotic cell that can differentiate as an EC)50. ISC activation promotes midgut regeneration of functional enterocytes (through ISC proliferation/asymmetric division and differentiation of EBs) after tissue damage or significant EC loss, and ECs can non-autonomously dictate the proliferative status of ISCs through a variety of cues51,52,53,54. ISCs can be identified by the expression of Delta (Dl), a ligand for the Notch receptor, which activates the Notch signaling pathway in neighboring EBs to promote differentiation51,52,55. Midgut plasticity is thus shaped by epithelial remodeling, balancing cell gain and cell loss through control of ISC proliferative homeostasis. To this end, we uncovered that in control flies midgut ISCs adjust from inactive (quiescent) to active during the transition from fasting to refeeding, realized by increases in ISC proliferation (phospho-HistoneH3 [pH3]+ cells), and activation of ISC division and expansion (Dl+ cells) during the first 2-3 days of refeeding, before ISCs eventually start to return to quiescence (Fig. 1e, f and Supplementary Fig. 3d). Resizing of the midgut in response to nutrient adaptation is thus coupled to proliferative homeostasis. Similar to the changes in midgut length, Acbp6 function in enterocytes is required for ISC activation during refeeding, as attenuating Acbp6 (NP1Gal4>UAS-Acbp6RNAi) blocks increases in ISC proliferation and number (Fig. 1e, f and Supplementary Fig. 3d). Comparable results were obtained utilizing a temperature sensitive driver to attenuate Acbp6 only in the adult enterocytes (NP1Gal4,TubGal80ts > UAS-Acbp6RNAi, Supplementary Fig. 3e–f), and RNAi-mediated Acbp6 knockdown does not influence food intake rates during fasting-refeeding transitions (Supplementary Fig. 3g).
Furthermore, we generated an Acbp6 mutant fly line using CRISPR-Cas9 genome engineering in order to precisely target Acbp6 (leading to a distinct frameshift mutation in Acbp6; acbp6Δ1, Supplementary Fig. 4a–c). This mutant is viable, producing fertile homozygote adults (Supplementary Fig. 4d, e). acbp6Δ1 homozygote mutant flies also display a deficiency in midgut plasticity in response to nutrient adaptation, highlighted by attenuation of both midgut resizing and ISC activation uniquely during fasting-refeeding transitions compared to revertant wild-type controls (Fig. 1g–i). acbp6Δ1 heterozygote mutant flies display similar (although attenuated) phenotypes compared to homozygote mutants (gene-dosage effect), and re-expressing Acbp6 (UAS-Acbp6) can rescue the loss of ISC activation in acbp6Δ1 heterozygote mutants (Supplementary Fig. 4f–i). This highlights that these plasticity phenotypes are, indeed, influenced by Acbp6 function.
These loss-of-function phenotypes also underlie specificity in Acbp6 function during refeeding and resizing, as Acbp6 does not influence adult midgut sizing from development (ad libitum) or shrinkage during fasting (Fig. 1d, g). Acbp6 also does not influence shifts in proliferative homeostasis from steady-state (ad libitum) to nutrient deprivation, as ISCs appear to revert to a further state of inactivity in response to fasting (Fig. 1e, f, h and i).
Related to other Acbp paralogs specifically expressed in the Drosophila intestine, attenuation of Acbp3 or Acbp5 specifically in enterocytes (NP1Gal4>UAS-Acbp3RNAi or UAS-Acbp5RNAi) did not impede ISC proliferation during refeeding, whereas Acbp4 function in enterocytes is essential for pupal-adult developmental transitions (eclosion; NP1Gal4>UAS-Acbp4RNAi, Supplementary Fig. 5a–c). These data indicate that enterocyte-derived Acbp6 likely plays a distinct role in regulating midgut remodeling during nutrient adaptation. To this end, we explored potential nutrient-dependent regulators of Acbp6 expression. By performing a comparative analysis of the promoter/enhancer regions of the Acbp3, Acbp4, Acbp5, and Acbp6 genes, we identified a DNA binding motif (characterized as CTACCAA) for the transcriptional regulator Schlank located uniquely in the upstream promotor region of Acbp6 (Supplementary Fig. 5d). Schlank is a conserved ceramide synthase, which functions as both an enzyme and a nutrient- and homeodomain-dependent transcriptional regulator, often acting as a sensor for lipid levels to subsequently modulate gene expression56. Reducing Schlank function in enterocytes strongly decreases Acbp6-RFP reporter activity in the posterior midgut during fasting conditions (Acbp6-RFP, NP1Gal4>UAS-SchlankRNAi; Supplementary Fig. 5d, e). We also found that attenuation of Schlank (NP1Gal4>UAS-SchlankRNAi) impedes ISC proliferation during fasting-refeeding transitions (Supplementary Fig. 5f). Finally, investigating the transcriptional regulatory role of Schlank on different Acbp paralogs revealed that only Acbp6 expression is diminished following Schlank attenuation in enterocytes (Supplementary Fig. 5g). Collectively, these findings indicate that the ceramide synthase Schlank serves as an upstream regulator of Acbp6 during nutrient adaptation in the midgut.
Taken together, our results reveal that Acbp6 function in enterocytes is essential for midgut tissue plasticity during nutrient adaptation. Specifically, Acbp6 is required for intestinal resizing after nutrient deprivation (fasting-refeeding transitions) through activating intestinal stem cell proliferation from quiescence and thus adjusting proliferative homeostasis. These data also show that Acbp6 induction (during fasting through nutrient-responsive transcriptional regulators) precedes its functional requirement for tissue resizing after refeeding (Fig. 1d–i), suggesting that distinct spatio-temporal calibration by Acbp6 is critical for nutrient-dependent midgut plasticity.
Nutrient-dependent metabolic networks in the midgut are shaped by Acbp6 function
We next wanted to explore how Acbp6 and acyl-CoA metabolism influences nutrient-dependent metabolic networks in midgut enterocytes that could subsequently drive changes in tissue remodeling and proliferative homeostasis. Acbps are involved in selective partitioning of acyl-CoA, and can thus dictate acyl-CoA utilization for beta-oxidation in mitochondria or de novo lipid synthesis metabolic pathways in the cytoplasm31 (Fig. 2a). In control flies, we found that changes in midgut neutral lipid storage (indicative of lipid synthesis) are minimal during fasting-refeeding transitions (Fig. 2b, Supplementary Fig. 6a). This is also true of Fatty acid synthase 1 (FASN1) levels, a rate-limiting enzyme in lipid synthesis, which decrease during fasting and are restored to normal during refeeding (Fig. 2c, Supplementary Fig. 6b-c). However, attenuating Acbp6 in enterocytes (NP1Gal4>UAS-Acbp6RNAi) leads to increases in neutral lipid storage and elevated FASN1 levels in large, polyploid enterocytes, most prominently changed after refeeding (2 days, Fig. 2b, c, Supplementary Fig. 6a, b). Additionally, Acbp6 attenuation also leads to transcriptional upregulation, in the midgut and uniquely during refeeding, of genes essential for lipid synthesis from acyl-CoA pools (Fig. 2d-e, Supplementary Fig. 6c). These data suggest that Acbp6 inhibition in the midgut potentially limits mitochondria-related metabolic activity, but induces ectopic lipid synthesis and lipid accumulation. To this end, we also uncovered that attenuating Acbp6 in enterocytes limits mitochondrial dynamics during nutrient adaptation. While control flies are able to maintain mitochondrial homeostasis in the midgut during fasting-refeeding transitions, NP1Gal4>UAS-Acbp6RNAi flies display a severe loss of mitochondria number and intensity (monitoring ATP synthase-α subunit [ATP5A] immunostaining, Fig. 2f, Supplementary Fig. 6d, f) and mitochondrial membrane potential/function (TMRE, Fig. 2g, Supplementary Fig. 6e, g), mainly in midgut enterocytes. This loss of mitochondrial homeostasis starts during fasting and is sustained during refeeding (2 days). We also leveraged mito-GFP (a human mitochondrial import sequence [hCox8A] fused to GFP) as a marker of mitochondrial number and density, and found in controls that mitochondrial numbers decrease during fasting and increase upon refeeding, reflecting the dynamics of mitochondrial adaptation to nutrient availability in the midgut (Supplementary Fig. 6h–i). Furthermore, inhibiting Acbp6 function in enterocytes (UAS-mito-GFP, NP1Gal4>UAS-Acbp6RNAi) impedes the recovery of mitochondrial numbers after refeeding, suggesting a critical role for Acbp6 in regulating mitochondrial number/density in response to nutrient fluctuations (Supplementary Fig. 6h–i). Acbp6 inhibition also leads to transcriptional downregulation of genes (in the midgut) required for mitochondrial electron transport chain (ETC) function and OXPHOS, as well as crucial beta-oxidation enzymes/substrate carriers (Fig. 2a, h–k). These data highlight the impact of Acbp6 function on mitochondrial dynamics and proper regulation of metabolic pathways in the posterior midgut during nutrient adaptation. Likely related to this metabolic adaptation, Acbp6 function in midgut enterocytes is both necessary and sufficient to dictate organismal sensitivity to starvation (Supplementary Fig. 6j–k).
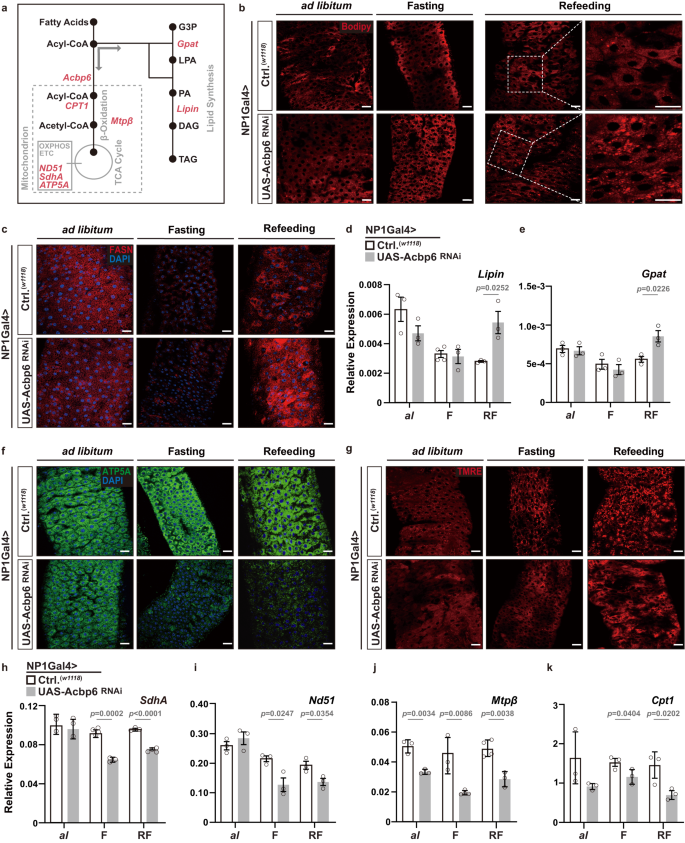
a Diagram of select genes and metabolites involved in lipid synthesis and mitochondrial function. G3P, glycerol-3-phosphate; LPA, lysophosphatidic acid; PA, phosphatidic acid; DAG, diacylglycerol; TAG, triacylglycerol. b–k Nutrient-dependent changes in metabolic network upon enterocyte-specific depletion of Acbp6. b Neutral lipid/lipid droplet fluorescent staining of dissected posterior midguts during nutrient adaptation; stained with Bodipy (red, reduced state). c FASN immunostaining of dissected posterior midguts during nutrient adaptation, stained with anti-FASN (red) and DAPI (nuclei, blue). d–e Transcriptional changes (measured by qRT-PCR) of Lipin d and Gpat e in dissected whole midguts during nutrient adaptation. d From left to right, bars represent n = 3, 3, 4, 3, 3 and 3 independent samples. e n = 3 independent samples. f Mitochondrial ATP5A immunostaining of dissected posterior midguts during nutrient adaptation, stained with anti-ATP5A (red) and DAPI (nuclei, blue). g Representative images of TMRE fluorescent histochemistry (red) of dissected posterior midguts during nutrient adaptation; TMRE (red). h–k Transcriptional changes (measured by qRT-PCR) of representative mitochondria genes, h SdhA, i Nd51, j Mtpβ, and k Cpt1, in whole dissected midguts during ad libitum (al) feeding, or fasting (F), or refeeding (RF). h From left to right, bars represent n = 3, 3, 4, 3, 3 and 4 independent samples. i n = 3 independent samples. j From left to right, bars represent n = 3, 3, 3, 3, 4 and 3 independent samples. k n = 3 independent samples. Bars represent mean ± SEM (unpaired 2-tailed Student’s t-test). The exact p values are provided in figure. Source data are provided as a Source Data file. Fasting represents 2 days of nutrient deprivation, and Refeeding represents 2 days of refeeding. All genotypes are as follows; w1118; NP1Gal4/+ (controls, Ctrl.) and w1118; NP1Gal4/UAS-Acbp6 RNAi. Scale bars, 10 μm.
We confirmed this aberrant ‘switching’ of metabolic networks (elevated lipid synthesis and attenuation of mitochondrial function) in acbp6Δ1 mutant flies during fasting-refeeding transitions. Also, re-expressing Acbp6 (UAS-Acbp6) can rescue these phenotypes in acbp6Δ1 heterozygote mutants, restoring mitochondrial numbers and function, as well as limiting lipid accumulation, in midgut enterocytes (Supplementary Fig. 7a–f, Supplementary Fig. 8a–e).
Our data suggest that Acbp6, induced in midgut enterocytes during nutrient deprivation when fatty acid activation and usage are enhanced, is required to partition acyl-CoA towards mitochondria, preserving mitochondrial homeostasis during nutrient adaptation (fasting-refeeding transitions).
Acbp6 function tunes acetyl-CoA metabolism and protein acetylation to regulate midgut tissue plasticity during nutrition adaptation
We hypothesized that aberrant ‘switching’ of metabolic networks in the absence of Acbp6 is likely to influence more than just energy output from mitochondria during nutrient adaptation. Beta-oxidation of fatty acids (via acyl-CoA), which boosts acetyl-CoA and citrate levels to feed the TCA cycle, can sustain mitochondrial OXPHOS and energy production, primarily ATP (adenosine triphosphate) (Figs. 2a and 3a). Moreover, citrate can be exported from mitochondria into the cytoplasm, where it freely diffuses into and out of the nucleus and can be converted into acetyl-CoA via ATP citrate lyase (ACLY)15 (Fig. 3a). Through fatty acid activation/oxidation, acyl-CoA can presumably tune acetyl-CoA metabolism and nuclear/cytoplasmic acetyl-CoA pools. To this end, we found that ubiquitous over-expression of Acbp6 (DaGal4>UAS-Acbp6) can elevate not only ATP levels, but also boost citrate synthase activity and acetyl-CoA levels (Fig. 3b–d).
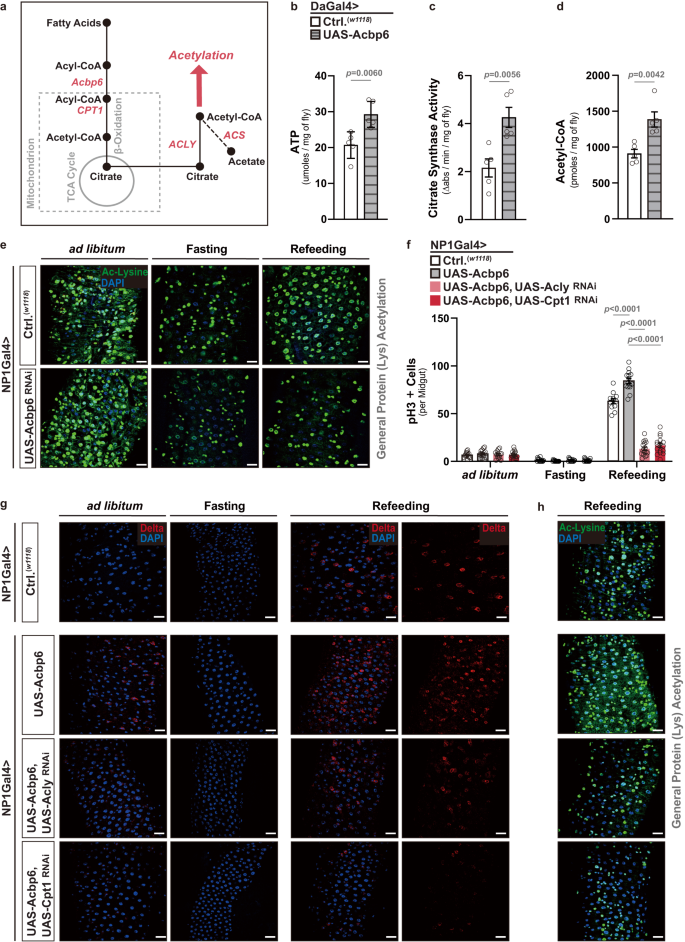
a Diagram of select genes and metabolites involved in acyl-CoA metabolism, acetyl-CoA metabolism, and acetylation. b–d Changes in various metabolite levels after whole-body upregulation of Acbp6 function. Genotypes; w1118; Daughterless (Da)Gal4/+ (controls, Ctrl.) and w1118; UAS-Acbp6/+; DaGal4/+. (5 whole flies per sample, n = 5 independent samples.) b Quantification of ATP (adenosine triphosphate) levels. c Quantification of citrate synthesis activity. d Quantification of acetyl-CoA levels. e Acetylated (Ac)-lysine immunostaining of dissected posterior midguts upon enterocyte-specific depletion of Acbp6 during nutrient adaptation, stained with anti-Ac-Lysine (green) and DAPI (nuclei, blue). Genotypes; w1118; NP1Gal4/+ (controls, Ctrl.) and w1118; NP1Gal4/UAS-Acbp6RNAi. f–h Genetic requirement of ACLY and CPT1 in Acbp6-dependent control of proliferative homeostasis during nutrient adaptation. f Quantification of phospho-Histone (H3) positive cells (per whole dissected midgut; from left to right, bars represent n = 15, 15, 14, 17, 15, 14, 15, 16, 12, 15, 17 and 16 independent samples), and immunostaining to detect g Delta positive cells in dissected posterior midguts (anti-Delta [red] and DAPI [nuclei; blue]), and h acetylated-lysine in dissected posterior midguts (stained with anti-Ac-Lysine (green) and DAPI (nuclei, blue) upon enterocyte-specific upregulation of Acbp6 or upregulation of Acbp6 and concurrent depletion of ACLY or CPT1 during nutrient adaptation (n = 3 independent experiments). Genotypes; w1118; NP1Gal4/+ (controls, Ctrl.), and w1118; NP1Gal4/UAS-Acbp6, and w1118; NP1Gal4, UAS-Acbp6/UAS-CPT1RNAi, and w1118; NP1Gal4, UAS-Acbp6/UAS-ACLYRNAi. Bars represent mean ± SEM (unpaired 2-tailed Student’s t-test). The exact p values are provided in figure. Source data are provided as a Source Data file. Fasting represents 2 days of nutrient deprivation, and Refeeding represents 2 days of refeeding. Scale bars, 10 μm.
As previously mentioned, acetyl-CoA metabolism can dramatically influence cellular signaling and cellular transcriptional outputs through impacting acetylation of histones and non-histone proteins21,57. We uncovered that Acbp6-mediated changes in metabolism are required to promote general protein acetylation during nutrient adaptation in the midgut. In control flies, we found that general (pan-) lysine acetylation (an evolutionarily conserved post-translational modification) is strongly reduced in the midgut in response to nutrient deprivation (2 days fasting), but is restored 2 days after refeeding (Figs. 3e and 4e). Pan-lysine acetylation is revealed throughout midgut cell types, but is most prominent in enterocyte nuclei (minimally in enterocyte cytoplasm, Fig. 3e and Supplementary Fig. 9a). Conversely, attenuating Acbp6 in enterocytes utilizing RNAi (NP1Gal4>UAS-Acbp6RNAi) completely limits the restoration of pan-lysine acetylation only during refeeding (Figs. 3e, 4e, Supplementary Fig. 9b). Similar changes in midgut pan-lysine acetylation were found in acbp6Δ1 heterozygote mutant flies during fasting-refeeding transitions (Supplementary Fig. 9c–e).
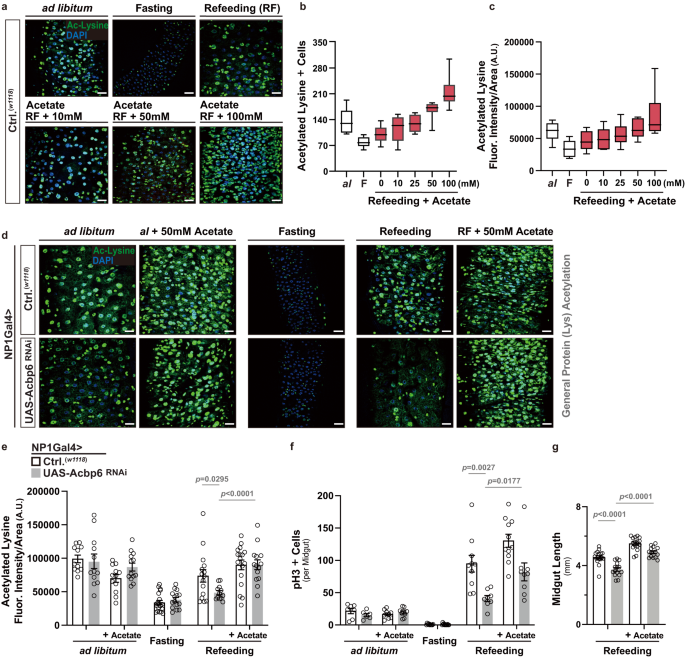
a–c Effects of dietary acetate supplementation on pan-protein acetylation in the midgut during nutrient adaptation. a Acetylated (Ac)-lysine immunostaining of dissected posterior midguts in control flies (w1118; [controls, Ctrl.]) during nutrient adaptation and with dose-dependent dietary acetate supplementation, stained with anti-Ac-Lysine (green) and DAPI (nuclei, blue). Quantification of b acetylated-lysine positive cells in dissected posterior midguts (per field; n = 10 independent samples) and c acetylated-lysine fluorescence intensity/area within dissected posterior midguts (per field; A.U. [Arbitrary Units]; n = 10 independent samples) with dose-dependent dietary acetate supplementation during refeeding (RF). Data in b, c are presented as box plots, with the boxes representing the mean values (center line), and upper and lower quartiles values (box limits), and the whiskers indicating the range. d Acetylated (Ac)-lysine immunostaining of dissected posterior midguts upon enterocyte-specific depletion of Acbp6 during nutrient adaptation and with dietary acetate supplementation (50 mM) during ad libitum and refeeding conditions, stained with anti-Ac-Lysine (green) and DAPI (nuclei, blue). Genotypes; w1118; NP1Gal4/+ (controls, Ctrl.) and w1118; NP1Gal4/UAS-Acbp6 RNAi. e–g Quantification of e acetylated-lysine fluorescence intensity/area in dissected posterior midguts (per field; A.U. [Arbitrary Units]; from left to right, bars represent n = 11, 12, 12, 13, 19, 15, 15, 12, 17 and 14 independent samples), f phospho-Histone (H3) positive cells (per whole dissected midgut; from left to right, bars represent n = 7, 6, 9, 9, 10, 13, 10, 8, 11, 9, 11 and 12 independent samples), and g midgut length measurement during refeeding with dietary acetate supplementation (50 mM) (from left to right, bars represent n = 18, 15, 16 and 15). Genotypes; w1118; NP1Gal4/+ (controls, Ctrl.) and w1118; NP1Gal4/UAS-Acbp6RNAi. Bars represent mean ± SEM (unpaired 2-tailed Student’s t-test). The exact p values are provided in figure. Source data are provided as a Source Data file. Fasting represents 2 days of nutrient deprivation, and Refeeding represents 2 days of refeeding. Scale bars, 10 μm.
These data suggest, at least, that general protein acetylation in midgut enterocytes, shaped by Acbp6-dependent changes in acetyl-CoA metabolism, plays a role in nutrient-dependent tissue plasticity. Consequently, we first explored whether key enzymes that shape acetyl-CoA metabolism are required for Acbp6-dependent effects on midgut proliferative homeostasis during nutrient adaptation. We targeted both ACLY (ATP citrate lyase) and CPT1 (Carnitine palmitoyltransferase 1), a mitochondrial enzyme that promotes the movement of acyl carnitine (generated through acyl-CoA) from the cytosol into the mitochondria to drive beta-oxidation of fatty acids (Fig. 3a). Attenuating Acly or Cpt1, utilizing RNAi, in enterocytes that over-express Acbp6 (NP1Gal4>UAS-Acbp6, UAS-AclyRNAi or UAS-Cpt1RNAi) strongly inhibits midgut ISC activation during the transition from fasting to refeeding (2 days, monitored by increases in pH3+ cells and Dl+ cells, Fig. 3f, g and Supplementary Fig. 10a). While ACLY and CPT1 are required for genetically induced Acbp6-dependent (UAS-Acbp6) increases in ISC activation during refeeding, these enzymes are also generally required (compared to increases in control flies, Fig. 3f). Thus, Acbp6-mediated metabolic adaptation likely plays a pivotal role in shaping nutrient-dependent tissue plasticity by modulating proliferative homeostasis through the regulation of acetyl-CoA metabolism. This dynamic interplay allows for the fine-tuning of cellular processes and ensures proper adaptation to changing nutrient conditions. To this end, ACLY and CPT1 are also required for Acbp6-dependent changes in general protein acetylation in the midgut during fasting-refeeding transitions (Fig. 3h).
Next, we wanted to further substantiate the integration of Acbp6 function, acetyl-CoA metabolism, and acetylation in the midgut during nutrient adaptation. We therefore tested whether dietary acetate supplementation can bypass the requirement for Acbp6 in shaping metabolic network that influence acetyl-CoA metabolism. Independent of mitochondria, acetate can be directly converted to acetyl-CoA through the enzyme Acetyl-CoA synthetase25,58 (ACS, Fig. 3a), and we found that acetate supplementation within food can dose-dependently increase pan-lysine acetylation in the midgut during refeeding (in control flies, monitored by the number of acetylated lysine+ cells or acetylated lysine fluorescence intensity per area (within a section of the posterior midgut, Fig. 4a–c). Utilizing a non-saturating dose (50 mM) that doesn’t impact pan-lysine acetylation in the midgut when flies are fed ad libitum or fasting (Fig. 4b, c, Supplementary Fig. 9b, Supplementary Fig. 10b), acetate supplementation can restore pan-lysine acetylation in NP1Gal4>UAS-Acbp6RNAi flies during refeeding (2 days, Fig. 4d, e, Supplementary Fig. 9b). Furthermore, acetate supplementation can also re-establish, in part, ISC activation/proliferation and restore midgut resizing during refeeding (2 days), different from ad libitum feeding or fasting, which is limited when Acbp6 is attenuated in midgut enterocytes (Fig. 4f, g, Supplementary Fig. 10c, d).
Taken together, these results highlight that Acbp6 and acyl-CoA metabolism in midgut enterocytes can dictate general (pan-) lysine acetylation, correlated with changes in ISC proliferative homeostasis, by tuning acetyl-CoA metabolism during nutrient adaptation. Distinctively, Acbp6 induction is thus linked with fatty acid activation during nutrient deprivation, providing acyl-CoA-dependent substrates for metabolic networks that presumably shape acetyl-CoA levels. This nutrient-dependent calibration of acetyl-CoA metabolism likely promotes rapid increases in general protein acetylation during refeeding, as well as tissue resizing, that dictate plasticity.
Nutrient-dependent acyl-CoA metabolism targets STAT function to dictate midgut tissue plasticity
Subsequently, we wanted to more deeply investigate the mechanistic link between Acbp6-dependent changes in acetylation and proliferative homeostasis (i.e., activating intestinal stem cell proliferation from quiescence) during nutrient adaptation. We observed that Acbp6-dependent and histone-specific changes in lysine acetylation (as opposed to general protein pan-lysine acetylation, Fig. 3e and Supplementary Fig. 9a, c) are minimal during fasting-refeeding transitions, and are not robustly changed in large, polyploid enterocytes (monitored by pan-histone [H3-K9/K14/K18/K23/K27] lysine acetylation, Supplementary Fig. 11a). In totality, our data at least suggest that non-histone protein acetylation in midgut enterocytes, directed by acyl-CoA metabolism, is influencing cell signaling pathways and further impacting ISC activation during fasting-refeeding transitions. In order to identify such pathways, and in the absence of distinct molecular tools, we decided to perform biased functional genetic screening of signaling pathways that have been shown to both; (I) be directly or indirectly influenced by acetylation-dependent post-translation modifications, and (II) control ISC quiescence-activation (and vice versa) transitions. We selected 7 transcription factors to genetically target, including; STAT92e (the only STAT in Drosophila), Foxo, Relish (Drosophila NF-kB), HNF4, Nrf2, PGC1alpha, and Myc, as well as one receptor, Egfr. Utilizing RNAi, we found that attenuating STAT92e in midgut enterocytes (NP1Gal4>UAS-STAT92eRNAi) could uniquely phenocopy Acbp6 loss-of-function effects on ISC activation, blocking both increases in ISC proliferation (Fig. 5a) and increases in stem cell number (Dl+ cells, Fig. 5b) during refeeding (2 days).
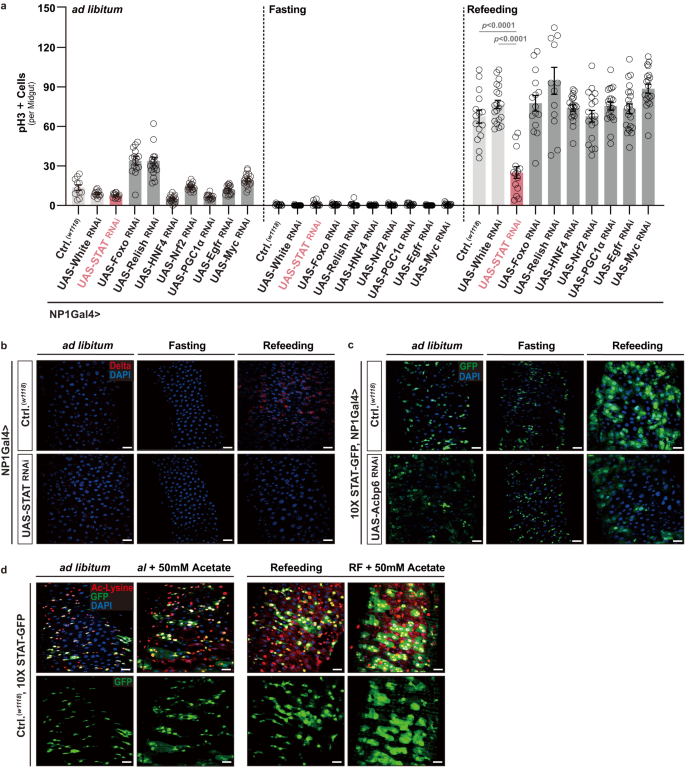
a Biased functional genetic screening to identify key regulators of Acbp6-dependent changes in proliferative homeostasis during nutrient adaptation. Quantification of phospho-Histone (H3) positive cells (per whole dissected midgut) upon enterocyte-specific depletion of various transcription factors or receptors during nutrient adaptation (utilizing RNAi, from left to right, bars represent n = 11, 13, 13, 15, 18, 18, 17, 15, 19, 18, 13, 18, 13, 16, 15, 18, 18, 15, 15, 15, 15, 20, 14, 15, 13, 19, 18, 20, 22 and 20 independent samples). Genotypes; w1118; NP1Gal4/+ (controls, Ctrl.) and w1118; NP1Gal4/UAS-GeneX RNAi. White RNAi was used as an additional control (w1118; NP1Gal4/UAS-White RNAi). b Immunostaining to detect Delta positive cells in dissected posterior midguts upon enterocyte-specific depletion of STAT (STAT92e) during nutrient adaptation; anti-Delta (red) and DAPI (nuclei; blue) (n = 3 independent experiments). Genotypes; w1118; NP1Gal4/+ (controls, Ctrl.) and w1118; NP1Gal4/UAS-STAT RNAi. c STAT92e activity (using 10X STAT-GFP transgenic reporter flies) in dissected posterior midguts during nutrient adaptation; stained with DAPI (nuclei, blue); GFP (green) (n = 3 independent experiments). Genotypes; w1118; 10X STAT-GFP, NP1Gal4/+ (controls, Ctrl.) and w1118; 10X STAT-GFP, NP1Gal4/UAS-Acbp6 RNAi. d Acetylated (Ac)-lysine immunostaining, and monitoring STAT92e activity, of dissected posterior midguts during nutrient adaptation and with dietary acetate supplementation (50 mM) during ad libitum and refeeding conditions, stained with anti-Ac-Lysine (green) and DAPI (nuclei, blue); GFP (green); w1118; 10X STAT-GFP/+ (controls, Ctrl.) flies (n = 3 independent experiments). Bars represent mean ± SEM (unpaired 2-tailed Student’s t-test). The exact p values are provided in figure. Source data are provided as a Source Data file. Fasting represents 2 days of nutrient deprivation, and Refeeding represents 2 days of refeeding. Scale bars, 10 μm.
Signal transducers and activators of transcription 92e (STAT92e) is a transcription factor directed by the Jak/STAT signaling pathway54. This pathway has been shown to regulate critical homeostatic processes in germline and somatic stem cells in Drosophila, as well as regenerative processes in several tissues54,59,60. Furthermore, in mammals, acetylation of various members of the STAT family of genes is known to impact transcription factor activity, localization, and stability61. In control flies, we found that STAT92e activity is strongly enhanced in the midgut during fasting-refeeding transitions (using an in vivo 10XSTAT-GFP reporter, Fig. 5c). STAT-GFP reporter activity is maintained in stem/progenitor cells, but increased in large, polyploid enterocytes during refeeding (2 days, Fig. 5c and Supplementary Fig. 11b). However, attenuating Acbp6 in enterocytes (NP1Gal4>UAS-Acbp6RNAi) restricts this nutrient-dependent STAT activation, indicating by the withdraw of STAT-GFP intensity in large, polyploid enterocytes (Fig. 5c). STAT92e activity is also sensitive to acetyl-CoA fluctuations, as acetate supplementation can further increase STAT-GFP reporter activity in enterocytes uniquely during refeeding, which correlates with elevated pan-lysine acetylation (Fig. 5d). These data suggest that STAT92e in midgut enterocytes is a crucial regulator downstream of Acbp6 and acyl-CoA-mediated acetyl-CoA metabolism that non-autonomously directs ISC proliferative homeostasis during nutrient adaptation.
An Acbp6-STAT92e-cytokine signaling axis adjusts proliferative homeostasis during nutrient adaptation
We next wanted to identify mitogenic signals, released from enterocytes, that could non-autonomously regulate this nutrient-dependent ISC activation and tissue plasticity. We uncovered that an Unpaired (Upd) cytokine ligand, specifically Upd3, is required for shaping ISC proliferative homeostasis during nutrient adaptation. Upd cytokine ligands generated in enterocytes have been shown to be sufficient to stimulate ISC proliferation through activating the Jak/STAT signaling pathway in ISCs54,62. We found that Upd3 transcription, but not Upd1 or Upd2, is impaired during refeeding (2 days) when Acbp6 is attenuated in midgut enterocytes (NP1Gal4>UAS-Acbp6RNAi, Fig. 6a). Additionally, Upd3 transcription is also impaired when STAT92e is attenuated in midgut enterocytes (NP1Gal4>UAS-STAT92eRNAi) in response to refeeding (2 days), whereas inhibiting Relish or Egfr in enterocytes (NP1Gal4>UAS-RelishRNAi or UAS-EgfrRNAi) cannot repress Upd3 transcription during fasting-refeeding cycle (Fig. 6b, Supplementary Fig. 11c). These data suggest that both Acbp6 and STAT92e are upstream of Upd3 regulation during nutrient adaptation. Furthermore, utilizing Upd3Gal4>UAS-GFP transgenic flies as an expression reporter, we observed that GFP induction and intensity is increased in midgut enterocytes uniquely during refeeding (2 days, Fig. 6c). Attenuating Acbp6 in this genetic background (i.e. in Upd3-expressing enterocytes; UAS-GFP, Udp3Gal4>UAS-Acbp6RNAi) limits GFP induction during nutrient adaptation (Fig. 6c). Similar to STAT92e, Upd3 induction is also sensitive to acetyl-CoA fluctuations, as acetate supplementation can further increase this GFP induction during refeeding (Fig. 6d). These data suggest that STAT92e regulation of Upd3 in enterocytes, ultimately driving Jak/STAT-mediated proliferation in intestinal stem cells, is required for nutrient-dependent changes in ISC proliferative homeostasis. To this end, attenuating STAT92e or Upd3, utilizing RNAi, in enterocytes that over-express Acbp6 (NP1Gal4>UAS-Acbp6, UAS-STAT92eRNAi or UAS-Upd3RNAi) strongly inhibits midgut ISC activation during the transition from fasting to refeeding (2 days, monitored by increases in pH3+ cells and Dl+ cells, Fig. 6e–g). Moreover, our findings demonstrate that the specific function of STAT92e in enterocytes is not essential for bacterial infection-induced midgut regenerative responses, as shown in Supplementary Fig. 11d–g. This observation suggests that enterocyte-derived STAT92e is not required to handle all external stresses but rather might play a slightly more specific role in nutrient adaptation processes.
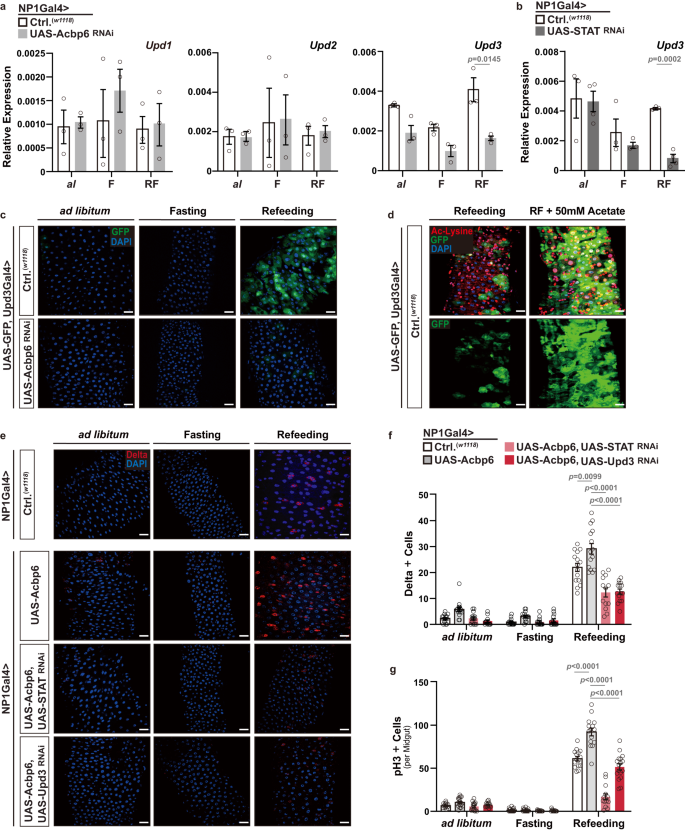
a Transcriptional changes (measured by qRT-PCR) of Upd1, Upd2 and Upd3 upon enterocytes-specific Acbp6 depletion during nutrient adaptation (n = 3 independent samples). Genotypes; w1118; NP1Gal4/+ (controls, Ctrl.) and w1118; NP1Gal4/UAS-Acbp6RNAi. b Transcriptional changes (measured by qRT-PCR) of Upd3 upon enterocyte-specific STAT (STAT92e) depletion during nutrient adaptation (from left to right, bars represent n = 3, 4, 3, 3, 3, and 4 independent samples). Genotypes; w1118; NP1Gal4/+ (controls, Ctrl.) and w1118; NP1Gal4/UAS-STATRNAi. c Upd3 expression patterns (using Upd3Gal4/UAS-GFP transgenic flies) in dissected posterior midguts during nutrient adaptation; stained with DAPI (nuclei, blue); GFP (green) (n = 3 independent experiments). Genotypes; w1118; UAS-GFP, Upd3Gal4/+ (controls, Ctrl.) and w1118; UAS-GFP, Upd3Gal4/UAS-Acbp6RNAi. d Acetylated (Ac)-lysine immunostaining, and monitoring Upd3 induction, of dissected posterior midguts during refeeding and with dietary acetate supplementation (50 mM), stained with anti-Ac-Lysine (green) and DAPI (nuclei, blue); GFP (green); (n = 3 independent experiments); w1118; UAS-GFP, Upd3Gal4/+ (controls, Ctrl.) flies. e–g Genetic requirement of STAT92e and Upd3 in Acbp6-dependent control of proliferative homeostasis during nutrient adaptation. e Immunostaining of Delta positive cells in dissected posterior midguts (anti-Delta [red] and DAPI [nuclei; blue]), and quantification of f Delta positive cells in dissected posterior midguts (per field; from left to right, bars represent n = 15, 14, 14, 12, 14, 14, 14, 13, 15, 15, 13 and 15 independent samples) and g phospho-Histone (H3) positive cells (per whole dissected midgut; from left to right, bars represent n = 14, 17, 15, 14, 22, 18, 15, 15, 15, 15, 14, and 17 independent samples) upon enterocyte-specific upregulation of Acbp6 or upregulation of Acbp6 and concurrent depletion of STAT or Upd3 during nutrient adaptation. Genotypes; w1118; NP1Gal4/+ (controls, Ctrl.), and w1118; NP1Gal4/UAS-Acbp6, and w1118; NP1Gal4, UAS-Acbp6/UAS-STATRNAi, and w1118; NP1Gal4, UAS-Acbp6/UAS-Upd3 RNAi. Bars represent mean ± SEM (unpaired 2-tailed Student’s t-test). The exact p values are provided in figure. Source data are provided as a Source Data file. Fasting (F) represents 2 days of nutrient deprivation, and Refeeding (RF) represents 2 days of refeeding. Ad libitum; al. Scale bars, 10 μm.
These data highlight an Acbp6/acyl-CoA – STAT – Upd3 regulatory axis that shapes ISC proliferative homeostasis, tissue resizing, and plasticity during nutrient adaptation. Nutrient-dependent calibration of acetyl-CoA metabolism and general protein acetylation, tuned by Acbp6, also underlie this regulatory axis through influencing STAT activation in midgut enterocytes.
- SEO Powered Content & PR Distribution. Get Amplified Today.
- PlatoData.Network Vertical Generative Ai. Empower Yourself. Access Here.
- PlatoAiStream. Web3 Intelligence. Knowledge Amplified. Access Here.
- PlatoESG. Carbon, CleanTech, Energy, Environment, Solar, Waste Management. Access Here.
- PlatoHealth. Biotech and Clinical Trials Intelligence. Access Here.
- Source: https://www.nature.com/articles/s41467-023-43362-4